
Understanding the financial pulse of tech giants like Google (officially Alphabet Inc.) is paramount for investors, market analysts, and even casual observers looking to grasp broader economic trends. “When are Google earnings?” is more than a simple calendar query; it’s an inquiry into the financial transparency and performance of one of the world’s most influential companies. Alphabet’s earnings reports offer a crucial quarterly snapshot of its diverse operations, from its dominant search engine and burgeoning cloud division to YouTube’s video empire and its ambitious “Other Bets.” These reports serve as a vital indicator not only for Alphabet’s future trajectory but also for the health of the digital advertising market and, by extension, the global economy.

In this comprehensive guide, we’ll delve into the rhythm of Alphabet’s financial disclosures, dissecting why these reports command such attention, what key metrics to scrutinize, and how understanding this cycle can inform your financial decisions.
The Significance of Alphabet’s Earnings Reports
Alphabet Inc. (NASDAQ: GOOGL, GOOG) is not just a technology company; it’s an economic powerhouse whose financial performance reverberates across multiple sectors. Its quarterly earnings reports are meticulously anticipated events, holding profound significance for various stakeholders.
Impact on Investors and Market Sentiment
For investors, Alphabet’s earnings release is a pivotal moment. The results can trigger significant movements in the company’s stock price, often influencing the broader market. Positive results, particularly those exceeding analyst expectations, can lead to rallies, boosting investor confidence. Conversely, a miss on revenue or earnings per share (EPS), or a weak outlook, can cause the stock to tumble, reflecting market disappointment and concerns about future growth. Long-term investors look for consistent growth, healthy margins, and clear strategic direction, while short-term traders actively seek to capitalize on the immediate volatility surrounding these announcements. Beyond Alphabet’s direct impact, its performance often sets the tone for other internet and advertising-reliant companies, acting as a bellwether for the entire tech sector.
Bellwether for the Digital Advertising Industry
Google’s advertising business, encompassing Search, YouTube, and its network members, constitutes the lion’s share of Alphabet’s revenue. Consequently, the company’s financial results are an indispensable indicator of the health and trends within the digital advertising industry. Analysts keenly observe ad revenue growth rates, traffic acquisition costs (TAC), and monetization trends across its platforms. A slowdown or acceleration in Google’s ad revenue can signal shifts in advertiser spending, consumer behavior, or the competitive landscape, providing valuable insights for marketers, competing platforms, and even businesses whose revenue streams are tied to online advertising.
Economic Health Indicator
Given Alphabet’s vast global footprint and its fundamental role in online commerce, communication, and information access, its earnings reports offer a proxy for broader economic health. Strong advertising revenue often correlates with robust consumer spending and business investment, suggesting a healthy economy. Conversely, a decline might hint at economic headwinds, reduced corporate budgets, or a tightening of consumer belts. Furthermore, the growth of Google Cloud, Alphabet’s enterprise cloud computing division, can indicate the pace of digital transformation and IT spending by businesses worldwide. Examining Alphabet’s geographic revenue breakdown can also provide insights into regional economic performance.
Understanding the Earnings Calendar and Process
Alphabet’s financial disclosures follow a predictable, albeit intense, schedule. Navigating this calendar is essential for anyone tracking the company.
Quarterly Cadence: Q1, Q2, Q3, Q4
Like all publicly traded companies, Alphabet reports its financial results on a quarterly basis. Each quarter roughly corresponds to three calendar months, ending on March 31 (Q1), June 30 (Q2), September 30 (Q3), and December 31 (Q4). The annual report (Form 10-K) is filed after the Q4 results, consolidating the entire fiscal year. While the exact date within the month varies, earnings are typically released within a few weeks after the close of the quarter. Investors often pay particular attention to the fourth-quarter results, as they include the critical holiday shopping season and complete the fiscal year.
Key Dates: Earnings Call, Release Date, Quiet Period
The process typically begins with the earnings release date, when Alphabet publishes its quarterly financial statements, press release, and often a supplemental data sheet. This release usually occurs after the market closes or before it opens to minimize disruption during trading hours. Shortly thereafter, the company hosts an earnings conference call (often an hour later), during which top executives (CEO, CFO) discuss the results, provide context, and offer forward-looking guidance. This call is followed by a Q&A session with financial analysts. Prior to the release, a quiet period is observed, during which company insiders are restricted from making public comments about the company’s financial performance to ensure fair and equal dissemination of information.
How Alphabet Schedules its Releases
Alphabet’s investor relations department officially announces the exact earnings release date approximately two to three weeks in advance. This information is published on the Alphabet Investor Relations website (ir.alphabet.com), through press releases, and often picked up by financial news outlets and calendar services. While there’s no fixed date (e.g., “always the third Tuesday”), Alphabet tends to follow a historical pattern, often releasing results in the latter half of the month following the close of the quarter. For instance, Q1 results (ending March 31) are usually released in April, Q2 in July, Q3 in October, and Q4 in January or early February. Prospective investors should always refer to the official investor relations site for the most accurate and up-to-date schedule.
What to Look For in an Alphabet Earnings Report
An Alphabet earnings report is a treasure trove of data, but knowing where to focus can make all the difference in extracting meaningful insights.
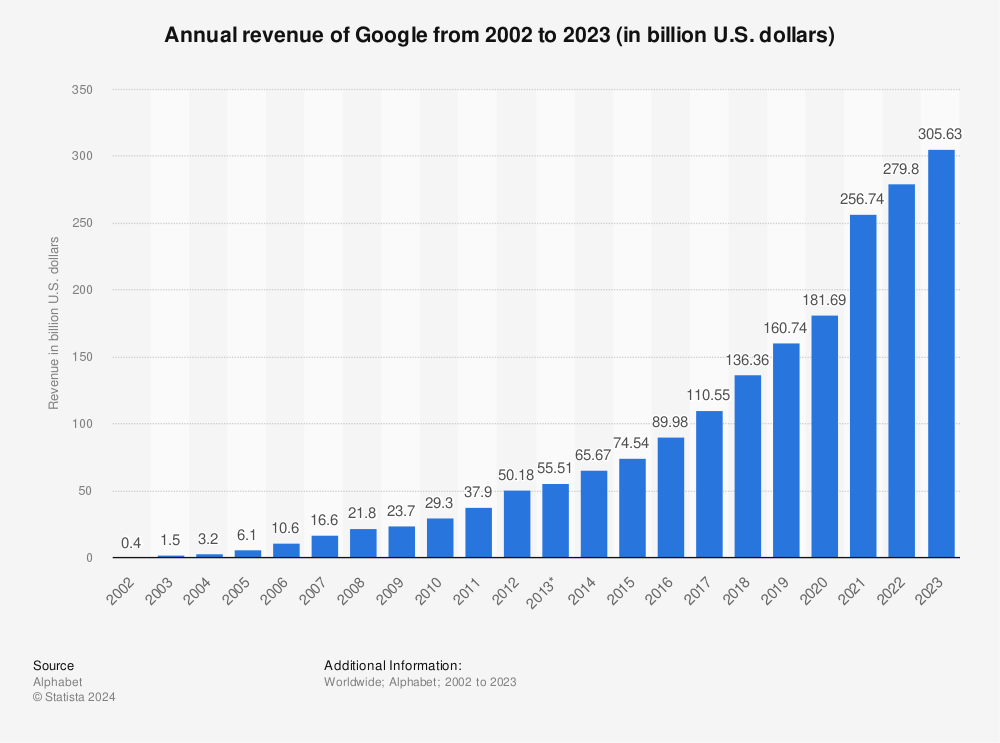
Revenue Breakdown: Google Search, Cloud, YouTube, Other Bets
Alphabet’s diverse revenue streams are crucial. The report breaks down revenue by segment:
- Google Search & other: This is historically the largest segment, driven by search advertising. Investors look for growth rates and signs of market share changes.
- YouTube ads: Revenue generated from advertising on the YouTube platform. Growth here reflects video consumption trends and advertiser demand.
- Google Network members’ properties: Revenue from ads displayed on partner websites and apps through Google’s ad network.
- Google Cloud: This segment, while smaller than advertising, is a high-growth area. Investors focus on its year-over-year growth and its path to profitability.
- Other Bets: This encompasses Alphabet’s speculative ventures like Waymo (self-driving cars), Verily (life sciences), and Calico (biotechnology). While often unprofitable, investors monitor their progress and potential long-term value.
- Other Revenues: Includes hardware sales (Pixel phones, Nest devices), Google Play revenue, and non-advertising revenues from YouTube.
Profitability Metrics: Net Income, EPS, Operating Margin
Beyond revenue, profitability is key.
- Net Income: The company’s total profit after all expenses, taxes, and interest have been deducted.
- Earnings Per Share (EPS): Net income divided by the number of outstanding shares. This is a widely cited metric and directly impacts stock valuation. Investors compare reported EPS against analyst consensus estimates.
- Operating Margin: Operating income divided by revenue, indicating how much profit a company makes from its core operations before interest and taxes. A healthy and improving operating margin signals efficient management.
- Free Cash Flow (FCF): Cash generated after accounting for capital expenditures. FCF is a strong indicator of a company’s financial health and its ability to fund future growth, pay dividends, or buy back shares.
Key Performance Indicators (KPIs): Traffic Acquisition Costs (TAC), Cloud Growth, Hardware Sales
Beyond standard financial metrics, specific KPIs offer deeper insights:
- Traffic Acquisition Costs (TAC): The amount Google pays to partners (e.g., browser makers, other websites) to direct traffic to its properties. An increase in TAC as a percentage of revenue can signal rising competition or declining monetization efficiency.
- Google Cloud Growth: The consistent high growth in Google Cloud revenue is vital as Alphabet diversifies beyond advertising. Its operating loss or profit margin is also closely watched for its path to profitability.
- Hardware Sales: Performance of devices like Pixel phones, Fitbit, and Nest smart home products provides insight into Alphabet’s consumer hardware strategy and its ability to compete with Apple and Samsung.
Management Commentary and Future Guidance
The executive commentary during the earnings call and the financial outlook provided (guidance) are often as impactful as the reported numbers themselves. Management provides context for the quarter’s performance, discusses strategic priorities, and offers projections for future revenue, profitability, and capital expenditures. Changes in guidance can significantly influence analyst models and investor sentiment. Look for discussions on AI integration, regulatory challenges, competitive pressures, and capital allocation strategies.
Strategies for Analyzing Alphabet’s Financials
Effective financial analysis of Alphabet goes beyond merely reading the headlines. It involves critical thinking and comparing data points to uncover trends and potential future performance.
Trend Analysis: Year-over-Year and Quarter-over-Quarter Comparisons
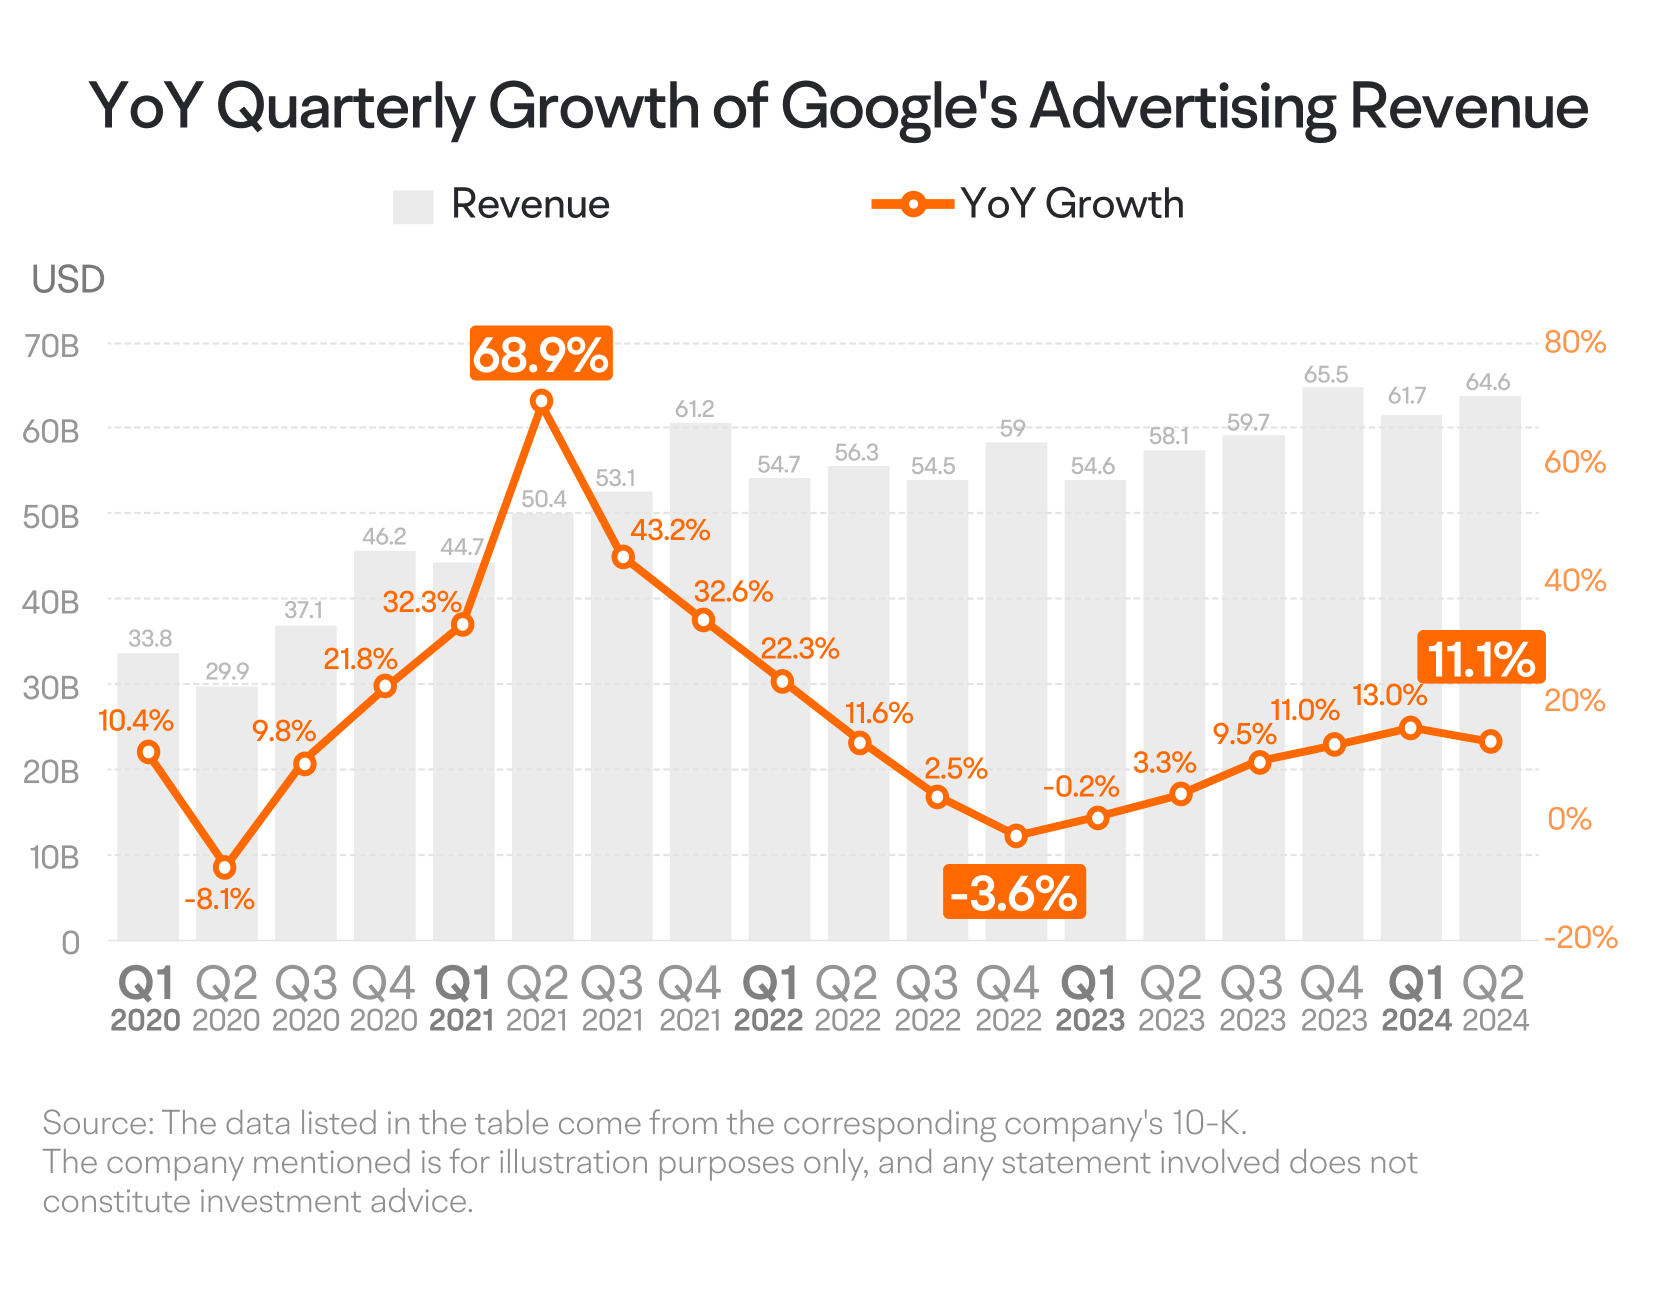
Comparing current results against the same quarter in the previous year (year-over-year or YoY) helps to normalize for seasonality and provides a clearer picture of underlying growth trends. Quarter-over-quarter (QoQ) comparisons can highlight more immediate operational changes or market shifts, although they need to be interpreted with an understanding of seasonality. Consistent positive YoY revenue growth, coupled with expanding profit margins, is typically a positive sign. Conversely, decelerating growth rates or declining margins warrant closer investigation.
Competitor Benchmarking
Analyzing Alphabet’s performance in isolation isn’t enough. It’s crucial to compare its growth rates, profit margins, and market share against its closest competitors. For advertising, this includes Meta (Facebook, Instagram) and Amazon. For cloud computing, it’s Amazon Web Services (AWS) and Microsoft Azure. Benchmarking helps determine if Alphabet is gaining or losing ground in its key markets and whether its financial efficiency is superior or inferior to its peers. This comparison offers valuable context on the company’s competitive standing and strategic effectiveness.
Connecting Macroeconomic Trends to Alphabet’s Performance
Alphabet’s financial results are not immune to broader economic forces. Analysts must consider how factors like inflation, interest rates, consumer spending habits, geopolitical events, and regulatory changes might impact its various revenue streams. For instance, an economic downturn often leads to reduced advertising budgets, directly impacting Google’s core business. Conversely, a strong economy with high consumer confidence might boost ad spending and hardware sales. Understanding these connections helps in predicting future performance and interpreting unexpected results.
The Broader Implications for Your Portfolio
For individual and institutional investors alike, understanding “when are Google earnings” and what they mean has significant implications for portfolio management.
Long-Term vs. Short-Term Investing Perspectives
For short-term traders, earnings announcements are volatility events, offering opportunities for quick gains or losses. They focus on beating or missing analyst estimates and the immediate market reaction. Long-term investors, however, use earnings reports to validate their investment thesis. They look for consistent execution of strategic goals, sustainable growth, strong free cash flow generation, and prudent capital allocation. While short-term fluctuations can be concerning, a long-term investor focuses on the underlying business fundamentals and future potential reflected over multiple quarters.
Diversification and Risk Management
Even with strong companies like Alphabet, concentrating too much of a portfolio into a single stock carries inherent risks. While Alphabet is a dominant player, its stock price can be subject to sector-specific downturns, regulatory pressures, or competitive threats. Therefore, understanding its earnings performance should be viewed within the context of a diversified portfolio, ensuring that no single company’s performance, no matter how strong, overly influences overall portfolio returns. Diligent investors consider Alphabet’s financial health as one component of a broader, balanced investment strategy.
Beyond the Numbers: Qualitative Factors
While the numbers in an earnings report are critical, savvy investors also consider qualitative factors. These include the strength of management’s vision and execution, company culture, innovation pipeline, brand reputation, ethical practices, and regulatory environment. For Alphabet, ongoing antitrust concerns, data privacy regulations, and the rapid evolution of AI technology are significant qualitative factors that can influence its long-term financial health and investor perception, even if they don’t appear directly in quarterly revenue figures. A holistic view, combining quantitative analysis with qualitative insights, provides the most robust understanding of Alphabet’s investment potential.
In conclusion, “when are Google earnings” marks a critical juncture in the financial calendar, offering a window into the operations of one of the world’s most influential companies. By diligently tracking these reports and understanding the financial metrics and market implications, investors and analysts can make more informed decisions, navigate market dynamics, and gain a clearer perspective on the future trajectory of Alphabet and the broader digital economy.
aViewFromTheCave is a participant in the Amazon Services LLC Associates Program, an affiliate advertising program designed to provide a means for sites to earn advertising fees by advertising and linking to Amazon.com. Amazon, the Amazon logo, AmazonSupply, and the AmazonSupply logo are trademarks of Amazon.com, Inc. or its affiliates. As an Amazon Associate we earn affiliate commissions from qualifying purchases.