
In the dynamic world of finance, few metrics capture the attention of investors, economists, and the general public quite like the S&P 500. It’s more than just a number; it’s a living, breathing barometer of the U.S. economy and a cornerstone for countless investment strategies. For anyone looking to understand the health of their portfolio, the broader market, or even the nation’s economic pulse, knowing “what’s the S&P 500 at” is often the first step in a well-informed financial journey. This article will delve into the significance of the S&P 500, explain why its movements matter, guide you on how to track it, and explore how it integrates into sound investment principles.

The S&P 500: A Premier Barometer of the U.S. Economy
Before discussing its current standing, it’s crucial to understand what the S&P 500 truly represents. It’s not just an arbitrary collection of stocks, but a meticulously constructed index that offers a robust snapshot of America’s corporate health.
What is the S&P 500?
The S&P 500, officially known as the Standard & Poor’s 500, is a stock market index that represents the performance of 500 of the largest publicly traded companies in the United States. Unlike the Dow Jones Industrial Average, which is price-weighted and composed of just 30 large companies, the S&P 500 is market-capitalization weighted. This means that companies with larger market values have a greater impact on the index’s overall performance. It’s broadly considered the best gauge of large-cap U.S. equities and, by extension, the health of the U.S. economy. The index is maintained by S&P Dow Jones Indices, a joint venture majority-owned by S&P Global.
The Companies Behind the Index
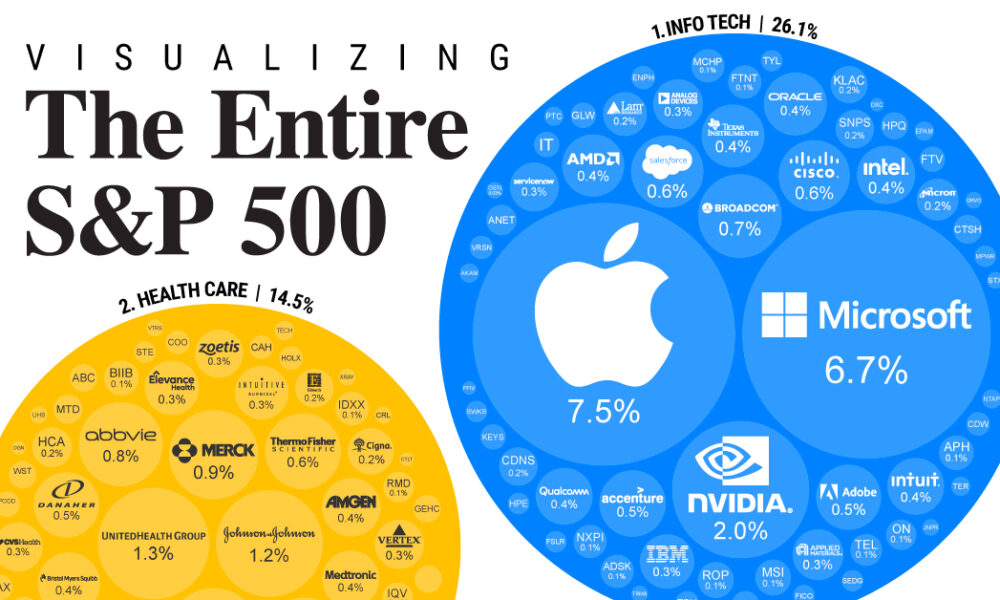
The 500 companies within the S&P 500 span every major sector of the U.S. economy, including technology, healthcare, financials, consumer discretionary, industrials, and more. Giants like Apple, Microsoft, Amazon, Google (Alphabet), and Tesla are prominent components, but the index also includes established names from traditional industries. The sheer breadth and depth of these companies mean that their collective performance reflects diverse aspects of consumer spending, business investment, technological innovation, and global trade. When the S&P 500 moves, it’s because the aggregate value of these economic titans is shifting, reflecting investor confidence and corporate profitability across a vast spectrum.
Historical Performance and Growth
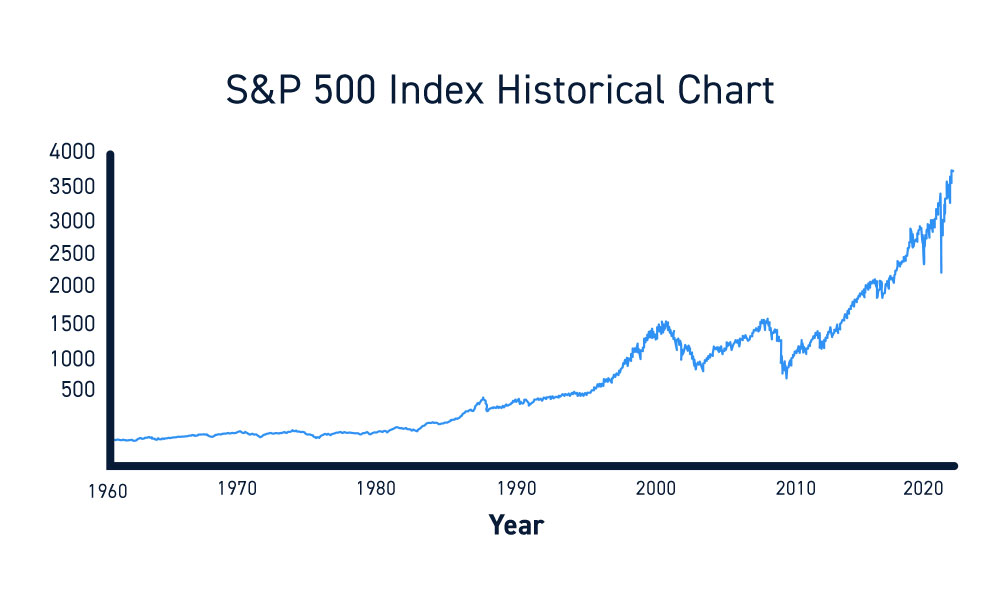
Over the long term, the S&P 500 has demonstrated a remarkable upward trend, punctuated by periods of significant volatility. Historically, its average annual return has been approximately 10-12% since its inception, though past performance is never an indicator of future results. This long-term growth is a testament to the resilience and innovation of American businesses. It highlights the power of compounding returns and forms the bedrock of passive investing strategies that aim to capture this market-wide growth. Understanding this historical context helps investors maintain perspective during short-term market fluctuations, emphasizing the importance of a long-term outlook.
Why Investors Track This Crucial Index
The S&P 500 isn’t just a headline number; it serves multiple vital functions for individual and institutional investors alike, making it an indispensable tool in financial analysis and strategy.
As a Benchmark for Portfolio Performance
For many investors, the S&P 500 acts as the ultimate benchmark. If your investment portfolio is heavily diversified across U.S. large-cap stocks, comparing its performance against the S&P 500 offers a straightforward way to assess whether your investments are keeping pace with, outperforming, or underperforming the broader market. Active fund managers are often judged by how well their funds perform relative to the S&P 500, with outperformance justifying higher fees. For passive investors using index funds or ETFs that track the S&P 500, the index is their portfolio’s performance, simplifying monitoring significantly.
Indicating Market Sentiment and Health
The S&P 500’s daily movements are widely interpreted as indicators of overall market sentiment. A sharp rise often signals investor optimism, perhaps driven by positive economic data, strong corporate earnings, or technological breakthroughs. Conversely, a significant drop can reflect widespread fear, triggered by recessionary concerns, geopolitical instability, or unexpected corporate failures. Periods of sustained growth in the index typically characterize a “bull market,” while prolonged declines signify a “bear market.” These trends help investors gauge the prevailing mood and adjust their risk exposure if necessary, though it’s crucial to differentiate between short-term noise and long-term trends.
Impact on Broader Economic Forecasts
Beyond market sentiment, the S&P 500’s performance can influence and reflect broader economic forecasts. Strong corporate earnings, which drive the index higher, often correlate with robust GDP growth and high employment rates. Conversely, a sustained decline in the S&P 500 can precede or coincide with economic slowdowns, as declining corporate profits can lead to reduced investment and layoffs. Government agencies, economists, and policy makers often look to the index as one of several leading economic indicators, providing clues about consumer confidence, business investment, and the overall trajectory of the national economy.
Real-Time Tracking: Where to Find the Latest Data
In today’s interconnected world, knowing “what’s the S&P 500 at” is easier than ever. A multitude of platforms and tools provide real-time or near real-time data, allowing investors to stay informed minute-by-minute.
Financial News Websites and Apps
For quick and reliable access to the S&P 500’s current value, major financial news outlets are indispensable. Websites like Bloomberg.com, Reuters.com, WallStreetJournal.com, and CNBC.com prominently display the index’s current price, daily change, and percentage change on their homepages. Many also offer dedicated market data sections with interactive charts, historical data, and related news. Mobile apps from these same providers offer on-the-go access, sending notifications for significant market movements. Additionally, free tools like Google Finance and Yahoo Finance provide comprehensive market data, customizable watchlists, and chart analysis features.
Brokerage Platforms and Investment Tools
If you have an investment account, your brokerage platform is likely the most detailed and integrated source for S&P 500 data. Platforms from companies like Fidelity, Charles Schwab, Vanguard, E*TRADE, and Robinhood not only display the index’s performance but also allow you to see how it impacts your own holdings, especially if you invest in S&P 500 index funds or ETFs. These platforms often provide advanced charting tools, technical indicators, and news feeds directly relevant to market performance, enabling deeper analysis within your investment ecosystem.
Understanding Key Metrics
When you check the S&P 500, you’ll typically see several key metrics:
-
Current Point Value: This is the S&P 500’s latest price. For example, “S&P 500 at 5,200 points.”
-
Daily Change: The absolute change in points from the previous day’s closing price (e.g., “+50 points”).
-
Percentage Change: The daily change expressed as a percentage (e.g., “+0.96%”). This is often a more intuitive way to understand the magnitude of the day’s movement.
-
Open, High, Low, Close: These represent the day’s opening price, highest point, lowest point, and closing price, respectively.
-
52-Week Range: This shows the highest and lowest points the index reached over the past year, providing context for its current position.
Understanding these metrics helps you interpret the current state of the market more effectively, moving beyond just a single number to grasp the volatility and trend.
Interpreting Market Movements: Beyond the Daily Fluctuation
While tracking the S&P 500’s daily ups and downs can be captivating, true insight comes from understanding the underlying factors driving these movements and maintaining a long-term perspective.
Short-Term Volatility vs. Long-Term Trends
The S&P 500 can be highly volatile on a day-to-day or even hour-to-hour basis. These short-term fluctuations are often driven by news cycles, speculative trading, algorithmic trading, or immediate reactions to economic data releases. However, for most long-term investors, these daily swings are largely noise. A more productive approach is to focus on the long-term trends, observing the index’s performance over months, quarters, and years. Historically, despite numerous corrections and bear markets, the S&P 500 has demonstrated a consistent upward trajectory, rewarding patient investors who resist the urge to react to every dip and surge.
Factors Influencing S&P 500 Performance
A myriad of factors can influence the S&P 500. Key drivers include:
-
Corporate Earnings Reports: When the 500 companies report their quarterly earnings, the market reacts strongly to surprises – both positive and negative. Strong earnings indicate healthy business operations and often lead to upward revisions of stock prices.
-
Interest Rates: Decisions by the Federal Reserve on interest rates heavily impact borrowing costs for businesses and consumers. Higher rates can slow economic growth and reduce corporate profits, often leading to market declines, while lower rates can stimulate growth.
-
Inflation: Persistent inflation erodes purchasing power and can lead central banks to raise interest rates, creating a double whammy for market valuations.
-
Economic Data: Reports on GDP growth, employment figures, consumer spending, manufacturing output, and housing starts all provide clues about the economy’s strength and can move the market.
-
Geopolitical Events: Wars, trade disputes, political instability, and global pandemics can introduce uncertainty and risk, causing investors to pull back from riskier assets like stocks.
Understanding these interconnected factors allows for a more nuanced interpretation of market movements, helping investors contextualize the “why” behind the “what.”
The Role of Analyst Sentiment and Economic Indicators
Beyond direct financial data, analyst sentiment plays a significant role. Investment banks and research firms publish reports and ratings on S&P 500 companies, which can sway investor opinion. Furthermore, composite economic indicators, such as the Conference Board’s Leading Economic Index (LEI) or various consumer confidence surveys, provide forward-looking insights that can influence market expectations and, consequently, the S&P 500’s performance. Staying abreast of these broader indicators, rather than just the daily price, empowers investors to make more informed decisions.
Investing Strategies Centered Around the S&P 500
For many, the S&P 500 isn’t just a benchmark to observe; it’s a vehicle for investment. Strategies focused on the index offer a path to broad market exposure and diversification.
Index Funds and ETFs
The most common and efficient way to invest in the S&P 500 is through index funds or Exchange Traded Funds (ETFs) that track the index. These investment vehicles hold the same stocks as the S&P 500, in the same proportions, giving investors immediate diversification across 500 large U.S. companies with a single purchase.
-
Index Funds: Typically mutual funds that aim to mirror the S&P 500. They are bought and sold at the end of the trading day based on their Net Asset Value (NAV).
-
ETFs: Similar to index funds but trade like individual stocks on an exchange throughout the day. They often boast very low expense ratios, making them a cost-effective choice for long-term investors. Examples include SPY, IVV, and VOO.
Investing in these funds is a core tenet of passive investing, allowing individuals to capture market returns without needing to pick individual stocks.
Dollar-Cost Averaging
For those consistently investing in S&P 500-tracking funds, dollar-cost averaging is a highly effective strategy. This involves investing a fixed amount of money at regular intervals (e.g., $200 every month), regardless of the market’s current level. When prices are high, your fixed sum buys fewer shares; when prices are low, it buys more shares. Over time, this strategy averages out your purchase price, reduces the risk of trying to “time the market,” and can lead to significant accumulation of shares, especially during volatile periods. It removes emotion from investing, fostering discipline and long-term growth.
Diversification Beyond the S&P 500
While the S&P 500 provides excellent diversification within U.S. large-cap equities, it’s not the only component of a truly robust portfolio. To mitigate risk further and capture growth opportunities beyond this specific segment, investors should consider diversifying into:
-
International Stocks: Exposure to developed and emerging markets can provide geographical diversification.
-
Bonds: Government and corporate bonds offer stability and income, particularly during equity market downturns, and can help balance a portfolio’s risk.
-
Alternative Assets: While not for everyone, assets like real estate, commodities, or precious metals can offer further diversification against traditional stock and bond market movements.
A well-diversified portfolio typically allocates across various asset classes to optimize risk-adjusted returns, using the S&P 500 as a core component rather than the sole investment.
Long-Term Perspective and Rebalancing
The most critical aspect of investing, particularly in broad market indices like the S&P 500, is maintaining a long-term perspective. Despite inevitable market corrections and bear markets, the S&P 500 has historically recovered and reached new highs over extended periods. Patience and conviction in the underlying growth of the economy are paramount. Regular portfolio rebalancing (e.g., annually) is also crucial. This involves adjusting your asset allocation back to your target percentages by selling assets that have performed well and buying those that have underperformed. This ensures your risk profile remains consistent and prevents your portfolio from becoming over-concentrated in one area, even as the S&P 500 continues its journey.
In conclusion, understanding “what’s the S&P 500 at” goes beyond a simple number check. It’s about grasping its role as a key economic indicator, leveraging it as a benchmark for investment performance, and strategically incorporating it into a diversified, long-term financial plan. By staying informed, maintaining perspective, and adhering to sound investing principles, individuals can effectively navigate the complexities of the market and work towards their financial goals.
aViewFromTheCave is a participant in the Amazon Services LLC Associates Program, an affiliate advertising program designed to provide a means for sites to earn advertising fees by advertising and linking to Amazon.com. Amazon, the Amazon logo, AmazonSupply, and the AmazonSupply logo are trademarks of Amazon.com, Inc. or its affiliates. As an Amazon Associate we earn affiliate commissions from qualifying purchases.