
The question “What’s the current Dow Jones?” is one of the most frequently asked in the financial world, echoing daily from news desks to investor forums. While a simple number might seem like the complete answer, understanding the Dow Jones Industrial Average (DJIA) goes far beyond a single data point. It’s a barometer of American economic health, a snapshot of corporate performance, and a crucial piece of the puzzle for anyone navigating the complexities of personal finance and investing. For the individual investor, the business professional, or anyone merely curious about the economic pulse, comprehending the Dow’s current standing, its historical context, and its implications is invaluable. This article aims to demystify the DJIA, offering insights into its significance, how to interpret its movements, and how it fits into a broader financial strategy.

Understanding the Dow Jones Industrial Average (DJIA): More Than Just a Number
The Dow Jones Industrial Average, often simply called “the Dow,” holds a venerable position in financial history. Conceived in the late 19th century by Charles Dow and Edward Jones, it was designed to be a clear, simple indicator of the U.S. stock market’s overall health. Initially comprising just 12 industrial companies, it has evolved significantly, yet its core purpose remains: to provide a quick reference point for how the market’s leading companies are performing.
A Brief History of an American Icon
First published in 1896, the DJIA initially included prominent companies like General Electric (the only original component still listed on the index until 2018), American Cotton Oil, and U.S. Leather. Its creation coincided with America’s burgeoning industrial era, and as the economy transformed, so did the Dow. Through world wars, economic booms, the Great Depression, and numerous recessions, the Dow has stood as a persistent, if sometimes volatile, indicator of the nation’s economic journey. Its longevity and prominence have cemented its status as one of the world’s most watched and referenced market indices, becoming synonymous with the American stock market itself.
What the DJIA Actually Represents
At its core, the DJIA is a price-weighted average of 30 significant stocks traded on the New York Stock Exchange (NYSE) and the Nasdaq. These aren’t just any companies; they are carefully selected “blue-chip” corporations—large, well-established, and financially sound firms that are leaders in their respective industries. The index is not a perfect representation of the entire U.S. economy or even the entire stock market, but rather a snapshot of 30 influential components whose performance often reflects broader economic trends. Its focus on major industrial and service companies means it offers a specific, though powerful, lens through which to view market sentiment and corporate profitability.
The “Blue Chips” of the Dow
The companies composing the Dow are household names, representing a diverse cross-section of the U.S. economy, from technology and finance to healthcare and consumer goods. While once heavily focused on “industrial” firms, the composition has shifted over the decades to reflect the evolving economy. Today’s Dow includes tech giants like Apple and Microsoft, financial powerhouses like JPMorgan Chase, healthcare leaders like UnitedHealth Group, and consumer staples like Coca-Cola. The selection process is not based on rigid quantitative rules but rather on the committee’s judgment of a company’s reputation, sustained growth, investor interest, and sector representation. This ensures the index remains relevant and influential, even if its methodology is unique among major indices.
How the Dow Jones is Calculated and What Influences It
Understanding the numerical “current Dow Jones” requires a basic grasp of its calculation methodology, which differs significantly from other popular market indices like the S&P 500. This unique approach means that while it’s a widely cited figure, its movements can be influenced by specific factors that might not apply equally to other benchmarks.
The Price-Weighted Methodology Explained
Unlike market-capitalization-weighted indices (where larger companies by market value have a greater impact), the DJIA is a price-weighted index. This means that stocks with higher share prices have a greater influence on the index’s value than stocks with lower share prices, regardless of their total market capitalization. For instance, if a Dow component trading at $300 per share moves by $1, it will have a much larger impact on the overall index than a component trading at $50 per share moving by $1. This characteristic is a key distinction and sometimes a point of criticism, as it can give disproportionate weight to a company simply because its stock price is high.
The Dow Divisor: Maintaining Continuity
To ensure that the Dow’s value accurately reflects only the changes in stock prices and is not distorted by corporate actions, a special number called the “Dow Divisor” is used. When a stock split occurs, a company is removed or added, or a dividend is paid, the divisor is adjusted. The Dow’s current value is calculated by summing the prices of the 30 component stocks and then dividing that sum by the Dow Divisor. This divisor is crucial for maintaining the historical continuity and comparability of the index over time, preventing artificial jumps or drops due to non-market-related events. Without the divisor, historical comparisons would be meaningless after any structural change to the index.
Key Factors Driving Dow Movements
The daily fluctuations of the Dow are driven by a complex interplay of various factors, both micro and macro:
- Corporate Earnings and News: Individual company performance, earnings reports, mergers and acquisitions, and significant corporate announcements (like product launches or leadership changes) for any of the 30 components can directly impact their stock price and, by extension, the Dow.
- Economic Data: Broader economic indicators like GDP growth, inflation rates, employment figures (e.g., non-farm payrolls, unemployment rate), retail sales, and manufacturing data provide insights into the health of the U.S. economy, influencing investor sentiment and corporate outlooks. Strong economic data generally supports higher stock prices.
- Interest Rates and Monetary Policy: Decisions by the Federal Reserve regarding interest rates (e.g., the federal funds rate) significantly affect borrowing costs for businesses and consumers, influencing corporate profitability and economic activity. Lower rates typically encourage investment and spending, while higher rates can slow growth.
- Geopolitical Events: International political developments, trade disputes, conflicts, and global economic shifts can introduce uncertainty and volatility into markets, causing investors to re-evaluate risk and potentially leading to sharp movements in the Dow.
- Market Sentiment and Investor Psychology: Emotional factors, herd behavior, and overall market sentiment—whether bullish (optimistic) or bearish (pessimistic)—can amplify or mitigate the impact of fundamental news, sometimes leading to irrational exuberance or panic selling.
The Dow’s Significance for Investors and the Economy
While not a perfect proxy for the entire market, the Dow Jones Industrial Average remains immensely significant. Its movements are closely watched by individuals, institutional investors, economists, and policymakers alike, serving as a powerful, albeit focused, indicator of economic and market health.
A Barometer of Economic Health
The Dow is often referred to as a “barometer” for the U.S. economy. Because its components are large, influential companies across various sectors, their collective performance is seen as a strong reflection of the broader corporate landscape and consumer confidence. A steadily rising Dow typically signals a robust economy, with companies generating strong earnings, employment growing, and consumer spending remaining healthy. Conversely, a sustained decline can indicate economic headwinds, such as slowing growth, declining corporate profits, or increased economic uncertainty. While it doesn’t capture the entire economy (e.g., small businesses are not represented), its insights into the performance of major corporations are invaluable.
Impact on Investor Sentiment
Major movements in the Dow can have a profound psychological impact on investors. A significant rally often fuels optimism, encouraging more investment and spending, creating a positive feedback loop. Conversely, a sharp decline can trigger fear and uncertainty, leading to panic selling and a loss of confidence. This psychological dimension means the Dow’s daily performance is not just a statistical measure but also a driver of collective investor sentiment, which in turn can influence future market behavior. Understanding this emotional component is crucial for individual investors to avoid making impulsive decisions based solely on short-term market fluctuations.
Decision-Making for Businesses and Policymakers

Beyond individual investors, the Dow’s performance provides critical data for businesses and government policymakers. Corporations monitor the Dow and other indices to gauge the overall economic environment, which can inform decisions on investment, hiring, expansion, and capital allocation. Governments and central banks, like the Federal Reserve, consider stock market performance as one of several indicators when formulating monetary and fiscal policies. Extreme volatility or sustained declines in the Dow can signal a need for intervention to stabilize markets or stimulate economic growth.
Not a Full Picture, But an Important One
It’s vital to acknowledge that the Dow, with its 30 components, offers only a partial view of the vast and diverse U.S. stock market and economy. It doesn’t represent smaller companies, emerging industries, or the entire breadth of global economic influences on U.S. businesses. For instance, the tech-heavy Nasdaq Composite or the broader S&P 500 might offer different perspectives. However, despite these limitations, the Dow’s long history, the prominence of its components, and its widespread media coverage ensure its continued importance as a benchmark and a focal point for understanding market dynamics.
Interpreting Dow Jones Movements: A Guide for Informed Decisions
For investors and financial enthusiasts, simply knowing “what’s the current Dow Jones” isn’t enough; the real value lies in understanding how to interpret its movements. Reacting impulsively to daily fluctuations can be detrimental to long-term financial goals. A nuanced approach is required, distinguishing between transient volatility and significant trends.
Short-Term Volatility vs. Long-Term Trends
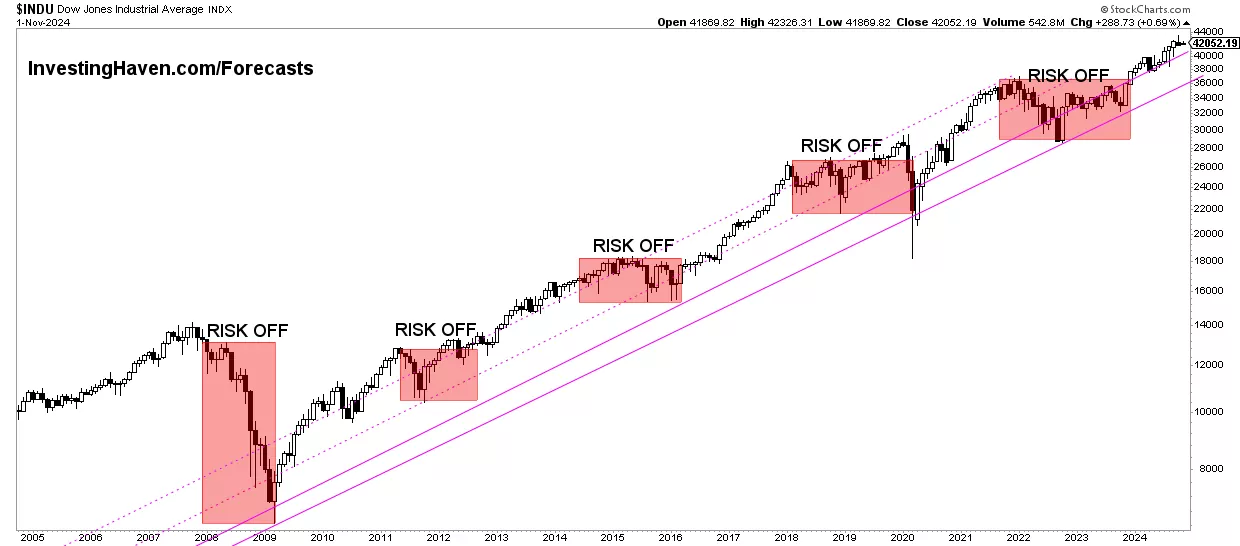
The Dow, like all market indices, experiences daily, even hourly, fluctuations. These short-term movements, often driven by breaking news, technical trading, or fleeting market sentiment, are known as volatility. While they grab headlines, they rarely indicate a fundamental shift in the economy or the long-term prospects of companies. Smart investors focus on long-term trends—sustained upward or downward movements over months or years. A single day’s 500-point swing might seem alarming, but if the overall trend for the past year has been positive, it should be viewed within that broader context. Long-term investors understand that market corrections are normal and that patience often outperforms panic.
What a “Point” Means (and Doesn’t Mean)
When the news reports “the Dow is up 300 points,” it’s easy to assume a massive gain. However, the significance of a point movement has changed dramatically as the index’s value has grown. A 300-point gain when the Dow is at 10,000 represents a 3% increase, which is substantial. But the same 300-point gain when the Dow is at 30,000 represents only a 1% increase. Therefore, it’s more insightful to look at percentage changes rather than absolute point changes to truly gauge the magnitude of a market move. A 1% movement, whether up or down, generally indicates a relatively normal trading day, while movements of 2% or more signal a more significant shift in sentiment or response to major news.
Common Pitfalls in Dow Interpretation
Several common mistakes can lead to misinterpretations of the Dow:
- Overreacting to Headlines: Media often sensationalizes market moves. A dramatic headline about a “market plunge” might refer to a modest percentage drop, which, while noteworthy, isn’t necessarily a sign of impending doom.
- Ignoring Context: Looking at the Dow in isolation without considering other economic data, earnings reports, or geopolitical events provides an incomplete picture.
- Chasing Returns: Investing solely based on what the Dow did yesterday or last week is a recipe for poor performance. True investing is about long-term strategy, diversification, and fundamental analysis.
- Believing the Dow is Omniscient: While important, the Dow is not the sole determinant of investment success or economic reality. It’s one data point among many.
Leveraging Financial Tools for Real-Time Data
For those seeking current Dow Jones data, numerous reliable financial tools and platforms are available. Major financial news websites (e.g., Bloomberg, Wall Street Journal, Reuters, CNBC), online brokerage platforms, and dedicated financial apps provide real-time or near real-time quotes. These platforms often include charts, historical data, and news feeds that offer valuable context for current movements. Utilizing these resources can help investors stay informed without being overwhelmed, allowing for more data-driven and less emotional decision-making.
Beyond the Dow: A Broader Look at Market Indicators
While the Dow Jones Industrial Average is a foundational benchmark, a comprehensive understanding of financial markets requires looking beyond its 30 companies. Relying solely on the Dow provides a narrow perspective; a holistic view incorporates other major indices and economic indicators to build a more robust investment strategy and understand the true state of the economy.
The S&P 500: A Wider Lens
Often considered a more representative barometer of the overall U.S. stock market than the Dow, the S&P 500 index tracks the performance of 500 of the largest publicly traded companies in the United States. Unlike the price-weighted Dow, the S&P 500 is market-capitalization-weighted, meaning companies with larger market values have a greater impact on the index. This broader scope and different weighting methodology often make the S&P 500 a preferred benchmark for many institutional investors and economists, as it captures a larger segment of the market’s total value and offers a more diversified snapshot of corporate America.
The Nasdaq Composite: A Tech-Heavy Counterpart
The Nasdaq Composite Index is another crucial market indicator, particularly important for tracking the performance of the technology sector and growth-oriented companies. The Nasdaq stock exchange is home to a vast number of tech, biotech, and internet companies, and its composite index reflects this concentration. Companies like Apple, Amazon, Microsoft, and Google (Alphabet) have a significant presence here. While the Nasdaq is broad (including over 3,000 stocks), its heavy weighting towards technology and innovative companies makes it an excellent indicator of investor sentiment towards these often high-growth, high-volatility sectors.
Other Economic Indicators to Watch
Beyond stock market indices, a well-rounded financial perspective integrates a variety of economic indicators:
- Gross Domestic Product (GDP): The total value of goods and services produced, indicating the overall size and health of the economy.
- Inflation Rates (CPI, PPI): Measures of price changes for goods and services, influencing purchasing power and central bank policy.
- Unemployment Rate and Job Growth: Key indicators of labor market health and consumer confidence.
- Consumer Sentiment and Spending: Surveys and data on consumer confidence and retail sales, crucial for an economy driven by consumption.
- Manufacturing and Services PMIs: Purchasing Managers’ Index reports offer insights into the health of the manufacturing and service sectors.
Monitoring these diverse indicators alongside the Dow, S&P 500, and Nasdaq provides a much clearer and more comprehensive picture of economic trends, allowing for more informed financial decisions.
Diversification and a Holistic View
Ultimately, sound personal finance and investing strategies emphasize diversification and a holistic view of the market. While knowing “what’s the current Dow Jones” is a good starting point, it should never be the sole basis for investment choices. Spreading investments across various asset classes (stocks, bonds, real estate), different sectors, and different market capitalizations helps mitigate risk. Furthermore, understanding the interplay between market indices, individual company performance, and broader economic factors allows investors to develop a more resilient portfolio and make decisions grounded in data and strategic planning rather than knee-jerk reactions to a single number.
In conclusion, the Dow Jones Industrial Average remains an iconic and influential market index. While its current value offers a momentary snapshot, its true utility lies in understanding its context, its historical significance, and how it fits into the broader mosaic of financial markets and economic indicators. For anyone engaged in personal finance or investing, a nuanced appreciation of the Dow, alongside other essential tools and information, is fundamental to navigating the path toward financial well-being.
aViewFromTheCave is a participant in the Amazon Services LLC Associates Program, an affiliate advertising program designed to provide a means for sites to earn advertising fees by advertising and linking to Amazon.com. Amazon, the Amazon logo, AmazonSupply, and the AmazonSupply logo are trademarks of Amazon.com, Inc. or its affiliates. As an Amazon Associate we earn affiliate commissions from qualifying purchases.