In the last decade, the intersection of health and technology has moved from the periphery of the “bio-hacking” community into the mainstream. One of the most significant metrics to emerge from this digital health revolution is $SpO_2$, or peripheral capillary oxygen saturation. For the average consumer, understanding what constitutes “good” oxygen levels is no longer just a task for medical professionals in clinical settings; it is a daily data point delivered to their wrists via sophisticated hardware and complex algorithms.
As we move deeper into the era of personalized medicine, the technology used to measure and interpret oxygen levels has become a cornerstone of the modern tech ecosystem. This article explores the technology behind these measurements, the software that interprets them, and the hardware innovations that have made oxygen monitoring a standard feature in our most personal devices.

The Evolution of Pulse Oximetry: From Medical Clinics to Consumer Gadgets
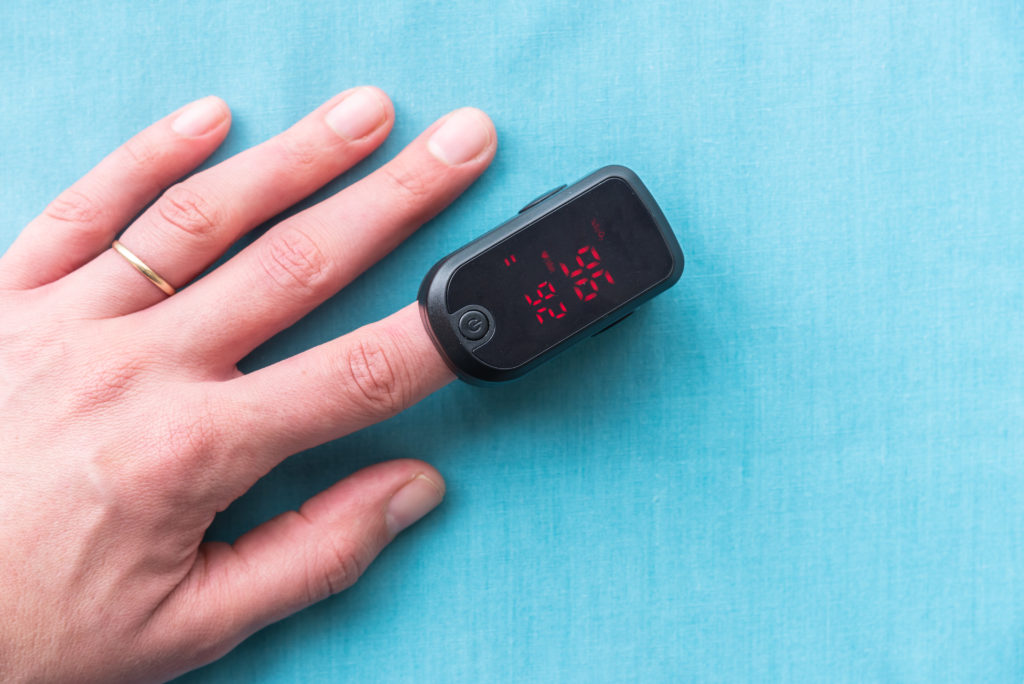
The technology used to measure blood oxygen levels is known as pulse oximetry. For decades, this was a bulky, specialized procedure found only in hospitals. However, the miniaturization of sensors and the advancement of light-emitting diode (LED) technology have transitioned this clinical tool into a consumer staple.
How PPG Sensors Work in Consumer Tech
Modern wearables utilize a technology called Photoplethysmography (PPG). This involves shining a combination of red and infrared light through the skin and onto the blood vessels. Oxygenated hemoglobin absorbs more infrared light and allows more red light to pass through, while deoxygenated hemoglobin does the opposite.
The tech inside a modern smartwatch or smart ring uses a photodetector to measure the light that isn’t absorbed. By calculating the ratio of red to infrared light, the device’s onboard processor can determine the percentage of oxygen in the blood. This process, which once required a dedicated machine, now happens in seconds on a device thinner than a pencil.
The Shift from Clinical Grade to Consumer Ready
The transition from clinical-grade oximeters (usually clipped to the fingertip) to wrist-based or ring-based sensors presented a massive engineering challenge. The wrist is a difficult place to measure $SpO_2$ because of bone structure, skin thickness, and “noise” created by movement. Tech giants have solved this through advanced software filtering and multi-wavelength LED arrays. This evolution represents a significant leap in sensor engineering, allowing for passive, continuous monitoring that was previously impossible.
Defining “Good” Oxygen Levels in the Digital Age
From a technical and physiological standpoint, “good” oxygen levels—or $SpO_2$—usually fall within a specific percentage range. Software interfaces on devices like the Apple Watch, Garmin, or Oura Ring are designed to help users visualize this data and understand when their levels might be deviating from the norm.
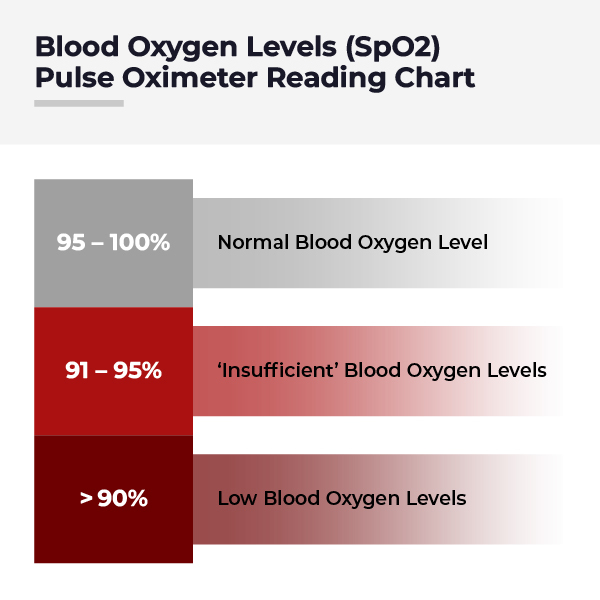
Understanding the 95% to 100% Threshold
In a healthy individual at sea level, a “good” or normal oxygen level is typically between 95% and 100%. When tech platforms display these numbers, they often use color-coded UI elements—green for optimal, yellow for caution, and red for potentially low levels (hypoxemia).
From a tech perspective, the challenge is maintaining accuracy within these narrow margins. A drop of just 3% or 4% can be clinically significant, which means the sensors and the software interpreting the data must have a very high degree of precision. Developers spend thousands of hours calibrating these sensors against “gold standard” arterial blood gas tests to ensure that the 98% you see on your app is as accurate as possible.
How Algorithms Filter “Noise” and False Readings
One of the most impressive feats of health tech software is the ability to filter out “artifacts”—erroneous data points caused by a loose watch band, sweat, or physical activity. High-end wearables use motion sensors (accelerometers and gyroscopes) to tell the $SpO_2$ algorithm when the user is moving. If the user is active, the software may delay the reading or use “noise-cancellation” logic to ensure that the movement doesn’t artificially lower the reported oxygen level. This intelligent data processing is what separates premium tech from budget-tier gadgets.
Leading Tech Solutions for Monitoring Blood Oxygen
The market for $SpO_2$ monitoring is currently dominated by a few key players who have integrated oxygen tracking into their larger health and wellness ecosystems. Each brand uses slightly different hardware configurations and software philosophies.
Smartwatches: Apple, Garmin, and Samsung
Apple introduced the Blood Oxygen app with the Series 6, utilizing four clusters of green, red, and infrared LEDs. Their approach focuses on “on-demand” readings and background measurements during sleep. Garmin, on the other hand, targets the high-performance athlete market with its “Pulse Ox” feature. Garmin’s tech is often tuned for altitude acclimation, helping hikers and climbers monitor how their oxygen levels drop as they ascend. Samsung integrates its $SpO_2$ tech into its broader “BioActive” sensor, which also measures body composition and heart rate.
Smart Rings and Specialized Sleep Tech
Smart rings, such as the Oura Ring or the Samsung Galaxy Ring, offer an alternative form factor. The advantage here is the proximity of the sensors to the arteries on the underside of the finger, which often provides a cleaner signal than the top of the wrist. These devices prioritize sleep tracking, using $SpO_2$ data to detect “breathing disturbances” that might indicate sleep apnea—a prime example of how hardware is being used for preventative health monitoring.
Integrated Apps and Data Ecosystems
The hardware is only half the story. The “good” oxygen levels are interpreted through software ecosystems like Apple Health, Google Fit, or Garmin Connect. These platforms aggregate $SpO_2$ data with heart rate variability (HRV), sleep stages, and activity levels to provide a holistic view of the user’s recovery and wellness. This “big data” approach allows the tech to notify a user if their average oxygen level has trended downward over a week, which might be a more useful insight than a single snapshot.
The Role of AI and Machine Learning in Health Metrics
As we look toward the future, the interpretation of oxygen levels is being revolutionized by Artificial Intelligence (AI) and Machine Learning (ML). These technologies are moving us away from reactive monitoring toward predictive analytics.
Predictive Analytics for Respiratory Health
By training ML models on millions of anonymous data points, tech companies are developing algorithms that can predict illness before symptoms appear. A sudden, slight dip in baseline $SpO_2$ levels, when combined with an elevated resting heart rate, can be an early indicator of a respiratory infection or even the onset of COVID-19. The AI isn’t just looking at what a “good” level is globally; it’s learning what a “good” level is specifically for you.
Cross-Referencing Metrics: Heart Rate vs. Oxygen
AI excels at finding correlations between disparate data sets. Advanced health tech platforms now cross-reference $SpO_2$ with heart rate and respiration rate. For instance, if your oxygen level drops while your heart rate remains steady, the software might conclude it’s a sensor error. However, if the drop coincides with a spike in heart rate during sleep, the AI can flag it as a potential case of obstructive sleep apnea, prompting the user to seek professional medical advice.
Security and Privacy in Personal Health Data
With the collection of sensitive biometric data like blood oxygen levels comes the critical need for digital security. This is a major focus for tech companies as they navigate the legal and ethical landscape of personal health information (PHI).
On-Device Processing vs. Cloud Storage
To enhance privacy, many tech leaders are moving toward on-device processing. This means the raw data from the $SpO_2$ sensor is analyzed locally on the watch’s processor rather than being sent to a remote server. When data is synced to the cloud, it is typically end-to-end encrypted. Companies like Apple and Google emphasize that they do not have the keys to decrypt this data, ensuring that even if a server breach occurs, the user’s health metrics remain private.
The Future of Remote Patient Monitoring (RPM)
The tech community is also looking at how this data can be shared securely with healthcare providers. Remote Patient Monitoring (RPM) is a growing sector where tech platforms allow users to opt-in to share their $SpO_2$ and other metrics directly with their doctor’s electronic health record (EHR) system. This creates a secure “digital bridge” between consumer gadgets and clinical care, ensuring that “good” oxygen levels are maintained under the supervision of medical professionals without the need for frequent office visits.
In conclusion, “good” oxygen levels are a vital sign of human health that has been successfully digitized. Through the marriage of advanced LED hardware, sophisticated noise-canceling software, and AI-driven insights, we now have the ability to monitor our respiratory health with unprecedented ease. As these technologies continue to evolve, the line between consumer electronics and medical devices will continue to blur, making us all more informed and empowered participants in our own health journeys.
aViewFromTheCave is a participant in the Amazon Services LLC Associates Program, an affiliate advertising program designed to provide a means for sites to earn advertising fees by advertising and linking to Amazon.com. Amazon, the Amazon logo, AmazonSupply, and the AmazonSupply logo are trademarks of Amazon.com, Inc. or its affiliates. As an Amazon Associate we earn affiliate commissions from qualifying purchases.