In the world of corporate finance and personal investing, few metrics carry as much weight as the Debt-to-Equity (D/E) ratio. It serves as a vital sign of a company’s financial health, revealing how much a business relies on borrowed money versus its own internal resources. Whether you are an entrepreneur looking to scale your business or an investor evaluating a stock for your portfolio, understanding the nuances of the D/E ratio is essential.
However, the question “What is a good debt-to-equity ratio?” does not have a single, universal answer. The “ideal” number shifts depending on the industry, the economic climate, and the specific growth stage of a company. To master this metric, one must look beyond the raw numbers and understand the strategic implications of financial leverage.
Understanding the Fundamentals of the Debt-to-Equity Ratio
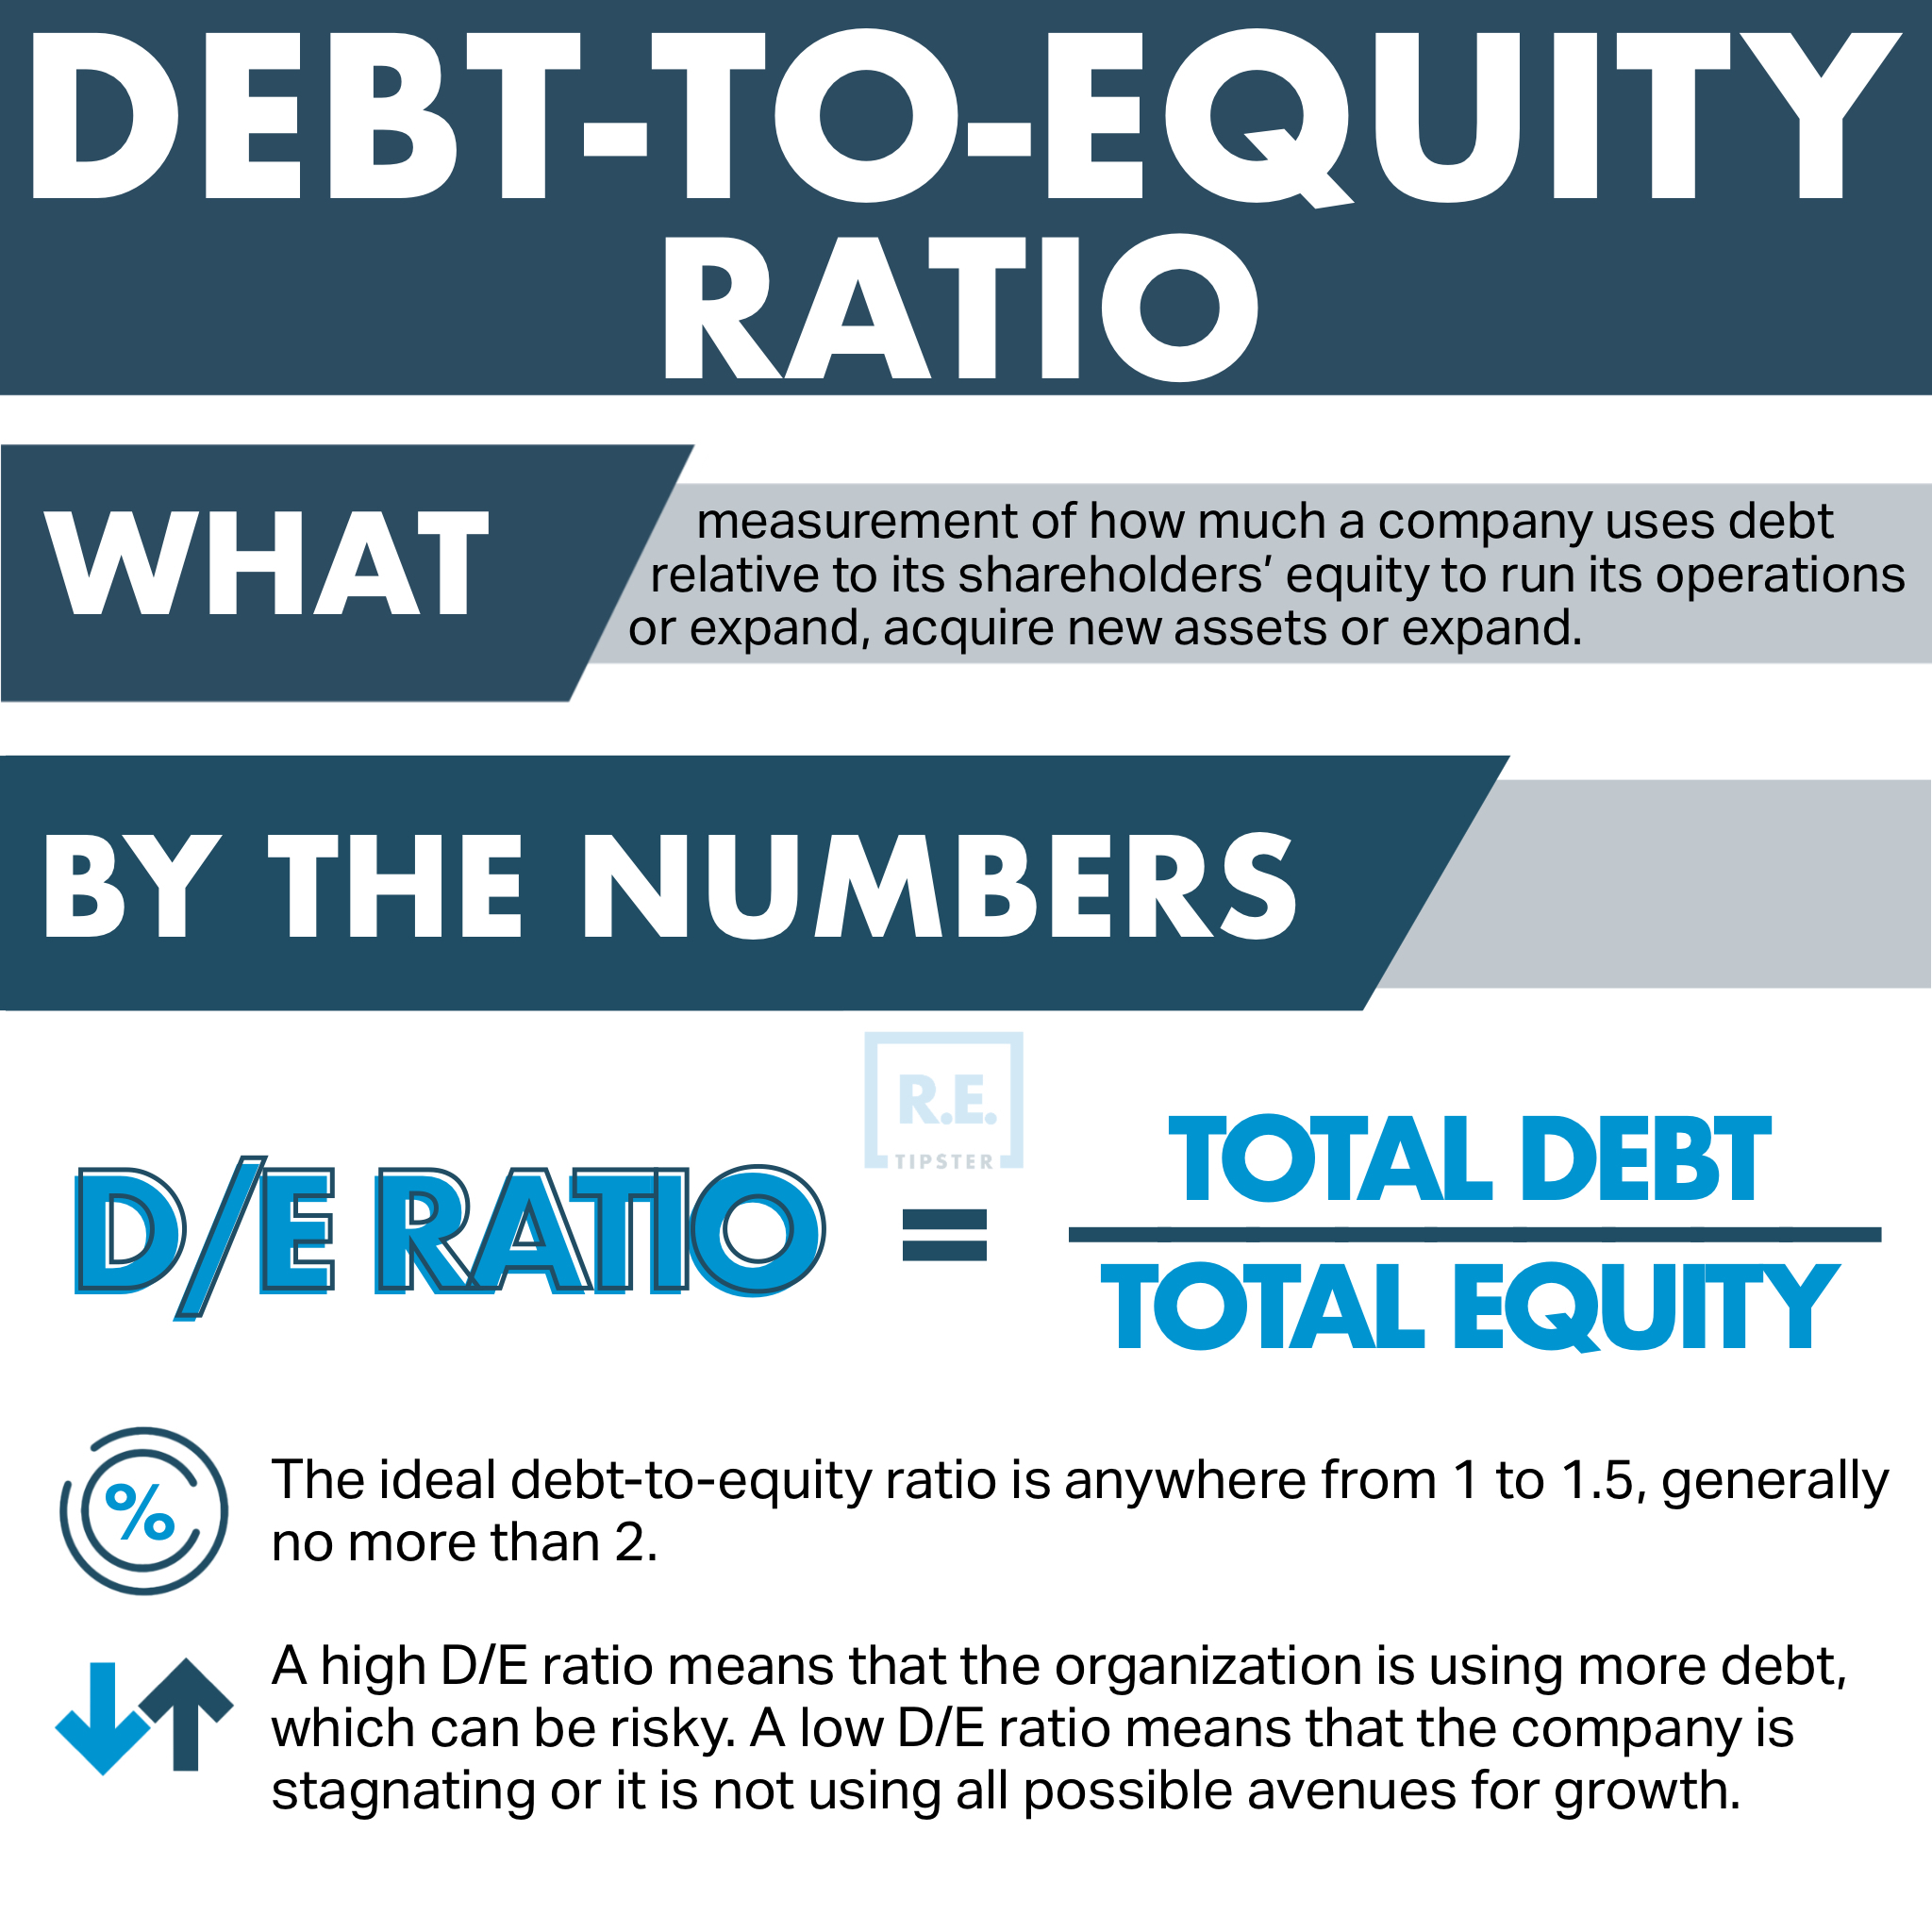
At its core, the Debt-to-Equity ratio is a leverage ratio that compares a company’s total liabilities to its shareholder equity. It is a snapshot of capital structure—essentially asking: “For every dollar owned by the shareholders, how much does the company owe to creditors?”
The Formula and Calculation
The formula for calculating the D/E ratio is straightforward:
Debt-to-Equity Ratio = Total Liabilities / Total Shareholder Equity
Total liabilities include both short-term debts (like accounts payable and taxes) and long-term obligations (like bank loans and corporate bonds). Shareholder equity represents the net worth of the company—the amount that would be left over if all assets were sold and all debts were paid off.
What Debt and Equity Represent
To understand the ratio, we must understand the two components of financing. Debt is borrowed capital. It allows a company to grow faster than it could using only its own cash. However, debt comes with the obligation of interest payments and the requirement to pay back the principal, regardless of the company’s performance.
Equity, on the other hand, represents ownership. When a company uses equity to fund its operations, it isn’t “borrowing” in the traditional sense; it is using the owners’ capital or issuing shares to investors. While equity doesn’t require monthly interest payments, it is often considered “expensive” because it involves giving away pieces of the company and potential future profits.
What Constitutes a “Good” Debt-to-Equity Ratio?
A common benchmark often cited by financial analysts is a D/E ratio of 1.0 to 1.5. A ratio of 1.0 means that the company is funded equally by creditors and shareholders. However, this is a broad generalization. In reality, a “good” ratio is entirely contextual.
General Benchmarks and Industry Standards
Different industries have vastly different capital requirements. For example:
- Capital-Intensive Industries: Sectors like utilities, manufacturing, and telecommunications require massive upfront investments in infrastructure and equipment. It is common and often considered healthy for these companies to have D/E ratios of 2.0 or higher. Because they have stable cash flows and physical assets to use as collateral, lenders are comfortable providing them with more leverage.
- Service and Tech Industries: Software companies or consulting firms typically have few physical assets. They don’t need to build factories to grow. For these sectors, a D/E ratio above 0.5 might be seen as risky. Investors in these fields usually prefer to see low debt and high cash reserves.
Why Context Is King
Beyond industry, the life cycle of a company plays a major role. A fast-growing startup might take on significant debt to capture market share quickly, resulting in a high D/E ratio. If their growth strategy is successful, the debt is seen as a powerful tool. Conversely, a mature company in a declining industry with a high D/E ratio is often a red flag, suggesting that they are borrowing money just to keep the lights on.
Analyzing High vs. Low D/E Ratios: Risks and Rewards
Neither a very high nor a very low D/E ratio is inherently “good” or “bad.” Each carries a specific set of trade-offs that business owners and investors must balance.
The Dangers of High Leverage
A high D/E ratio indicates that a company has been aggressive in financing its growth with debt. This can lead to volatile earnings because of high interest expenses.
- Default Risk: If a company’s revenue dips, it may struggle to meet its interest obligations, leading to bankruptcy.
- Sensitivity to Interest Rates: When central banks raise interest rates, companies with high debt see their costs soar, eating into profit margins.
- Restricted Cash Flow: Heavy debt servicing limits the amount of cash available for research, development, or dividends.
The Downside of Too Little Debt
While a low D/E ratio (or a ratio of zero) suggests extreme safety, it isn’t always optimal.
- Missed Growth Opportunities: By refusing to borrow, a company might grow much slower than its competitors who are using leverage to expand.
- Higher Cost of Capital: Interestingly, debt is often cheaper than equity because interest payments are tax-deductible. A company that uses zero debt may actually have a higher “Weighted Average Cost of Capital” (WACC), making it less efficient in the long run.
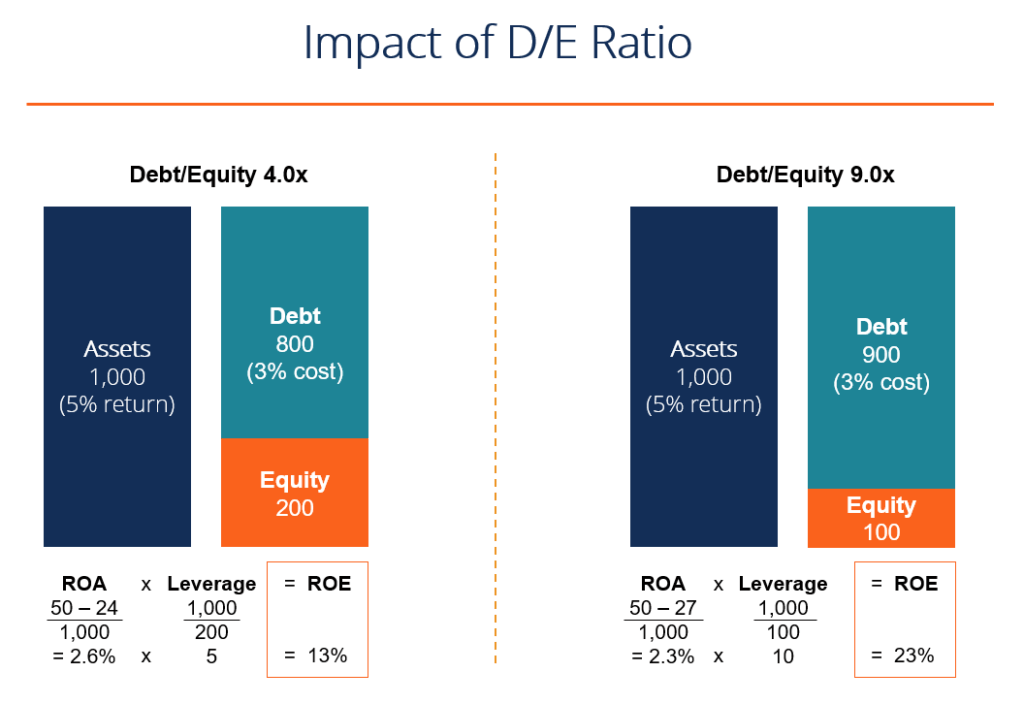
- Low Return on Equity (ROE): Leverage acts as a multiplier. If a company earns more on its investments than the interest it pays on its debt, the “leftover” profit significantly boosts the return for shareholders. Without debt, that multiplier effect is lost.
Using D/E Ratio in Investment Analysis and Business Management
For investors and business managers, the D/E ratio is most powerful when used as a comparative tool rather than a standalone figure.
Comparing Competitors
To determine if a company’s debt level is appropriate, you must compare it against its direct peers. If Company A has a D/E ratio of 1.2 and its three closest competitors have ratios of 0.8, Company A is relatively over-leveraged. This might indicate that Company A is taking more risks to keep up, or perhaps it is less efficient at generating internal cash.
Tracking Historical Trends
Looking at a single year’s D/E ratio can be misleading. It is far more insightful to look at the trend over three to five years.
- Decreasing D/E: Suggests the company is paying off its obligations and strengthening its balance sheet.
- Increasing D/E: Could mean the company is in an aggressive expansion phase, or it could be a warning sign that the company is relying on debt to cover operational losses.
Limitations of the Debt-to-Equity Ratio
While the D/E ratio is a cornerstone of financial analysis, it has limitations that can lead to a skewed perception of financial health if not carefully considered.
Short-term vs. Long-term Debt
The standard D/E calculation includes “Total Liabilities.” This can be problematic because short-term liabilities (like accounts payable) are often part of the normal day-to-day business cycle and don’t carry interest. Many analysts prefer to use the Long-Term Debt-to-Equity ratio, focusing only on interest-bearing debt. This provides a clearer picture of the long-term structural risks of the company.
Intangible Assets and Book Value Discrepancies
The “Equity” portion of the ratio is based on the “book value” of the company, which is an accounting measure. For many modern companies—especially those in branding, tech, or pharmaceuticals—the most valuable assets are intangible (like patents, brand reputation, or proprietary software). These are often not fully reflected in shareholder equity. Consequently, a company might appear to have a dangerously high D/E ratio on paper, but if its brand value is immense, it may actually be in a very strong position to handle its debt.

Conclusion: Balancing Risk and Growth
Ultimately, a “good” debt-to-equity ratio is one that supports the company’s strategic goals without compromising its long-term solvency. For a conservative investor, a ratio under 1.0 provides peace of mind. For a growth-oriented business owner in a stable industry, a ratio of 2.0 might be the perfect engine for expansion.
The key is to use the D/E ratio as a starting point for deeper inquiry. Does the company have the cash flow to service this debt? How does this ratio compare to the industry average? Is the debt being used to fund productive assets, or is it merely plugging holes in a leaky budget? By answering these questions, you move beyond simple ratios and gain a true understanding of financial strength and investment potential.
aViewFromTheCave is a participant in the Amazon Services LLC Associates Program, an affiliate advertising program designed to provide a means for sites to earn advertising fees by advertising and linking to Amazon.com. Amazon, the Amazon logo, AmazonSupply, and the AmazonSupply logo are trademarks of Amazon.com, Inc. or its affiliates. As an Amazon Associate we earn affiliate commissions from qualifying purchases.