
The cost of fuel is a fundamental pillar of personal finance, influencing everything from the feasibility of a daily commute to the price of groceries on the shelf. For many households, gasoline expenses represent a significant, non-negotiable line item in the monthly budget. To manage your finances effectively, it is essential to understand historical trends. By looking back at 2019, we can identify a baseline for “normal” fuel costs before the unprecedented volatility that characterized the subsequent years.
Understanding the economic climate of 2019 offers a benchmark for long-term budget planning. By analyzing these figures, you can better adjust your personal financial strategy to account for fluctuations, inflation, and changing energy markets.
The Economic Landscape of 2019 Energy Markets
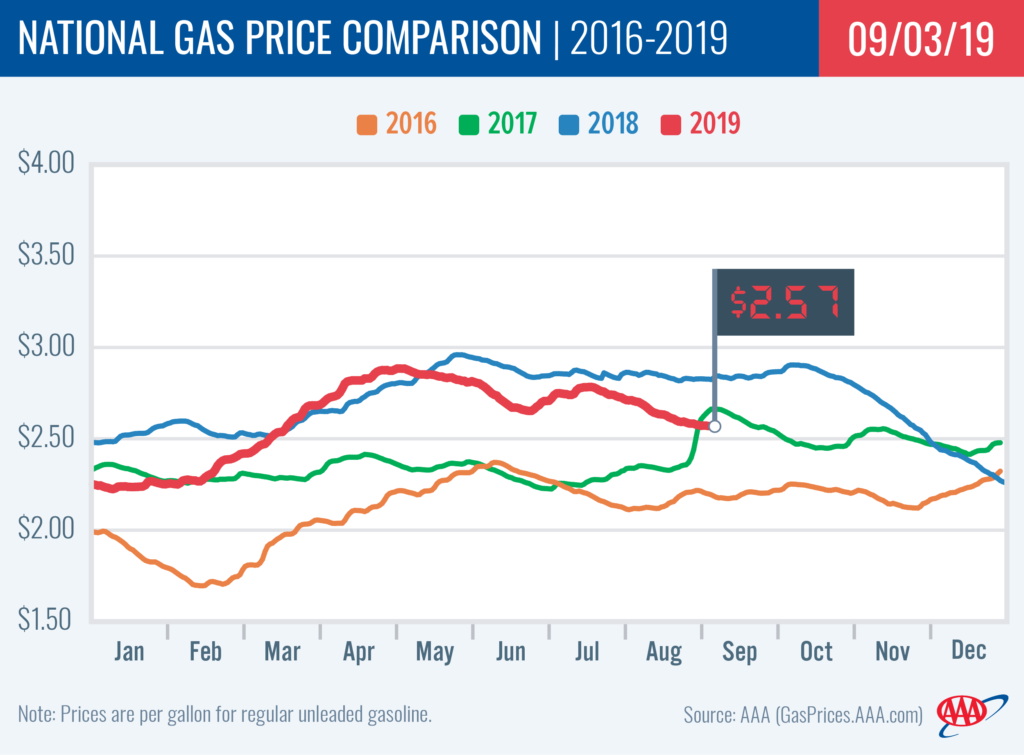
In 2019, the United States economy was experiencing a period of steady, albeit modest, growth. Crude oil prices were generally stable, oscillating within a range that allowed for predictable retail fuel pricing. This stability provided a sense of security for consumers, as the massive price swings that would dominate the post-pandemic era had not yet materialized.
National Averages and Regional Variance
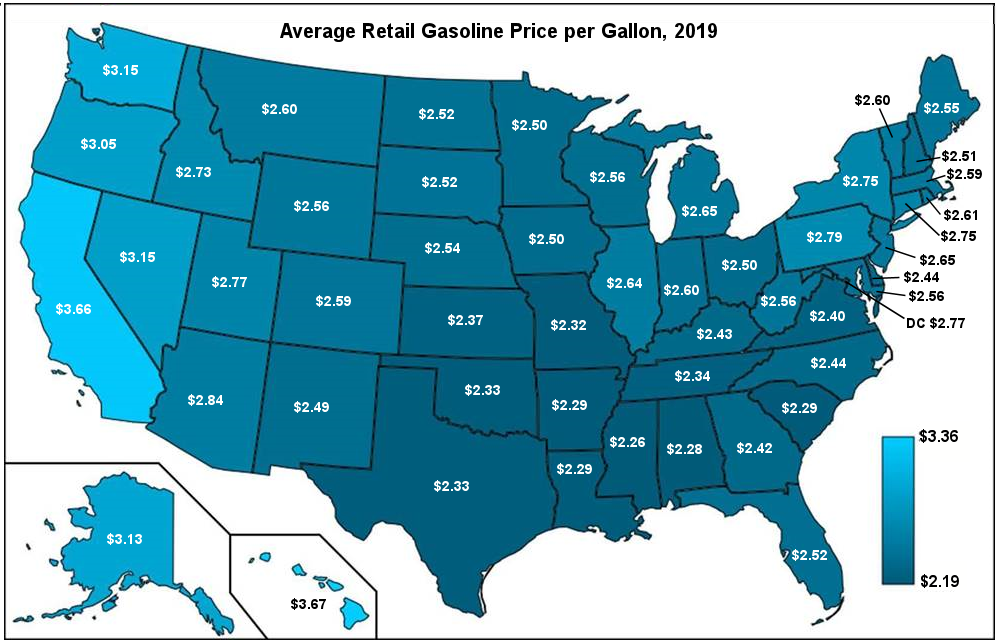
On average, the retail price for a gallon of regular unleaded gasoline in the United States during 2019 sat at approximately $2.60. However, this national average masks the significant regional disparities that dictate personal financial outcomes depending on where a person lives.
Drivers in the Gulf Coast region often enjoyed the lowest prices in the nation, frequently dipping below the $2.30 mark. Conversely, residents of the West Coast—particularly California—faced costs significantly higher, often hovering near or above $3.50. These differences underscore why location is a critical factor in wealth management. Your ability to save depends not only on your income but on your geographic cost-of-living index, which is heavily influenced by fuel logistics and state-level fuel taxes.
The Role of Domestic Production
The relative affordability of gas in 2019 was largely supported by a surge in domestic oil production. The United States had solidified its position as a global leader in crude oil output, which provided a buffer against geopolitical tensions that might otherwise have sent prices skyrocketing. For the average investor or household budgeter, this era serves as a reminder of how domestic industrial policy directly impacts the liquidity available in the average American bank account.
How Fuel Costs Impact Your Personal Financial Health
Gasoline is a unique commodity because, for most Americans, it is a low-elasticity good. Regardless of the price, people must drive to work, pick up children from school, and run essential errands. When gas prices rise, discretionary income shrinks. Understanding the 2019 data helps you create a “stress-test” for your budget.
The Hidden Inflation of Transportation
When gasoline costs increase, the cost of goods rises in tandem. Logistics and transportation companies pass the cost of fuel on to the consumer. In 2019, the relatively low price of gas helped keep inflation indices lower compared to later years. By analyzing these historical costs, you can better estimate how much “buffer” you need to maintain in your emergency fund. If you are currently budgeting based on 2019 costs, you are likely underestimating your current needs by a significant margin.
Budgeting for Fuel Volatility
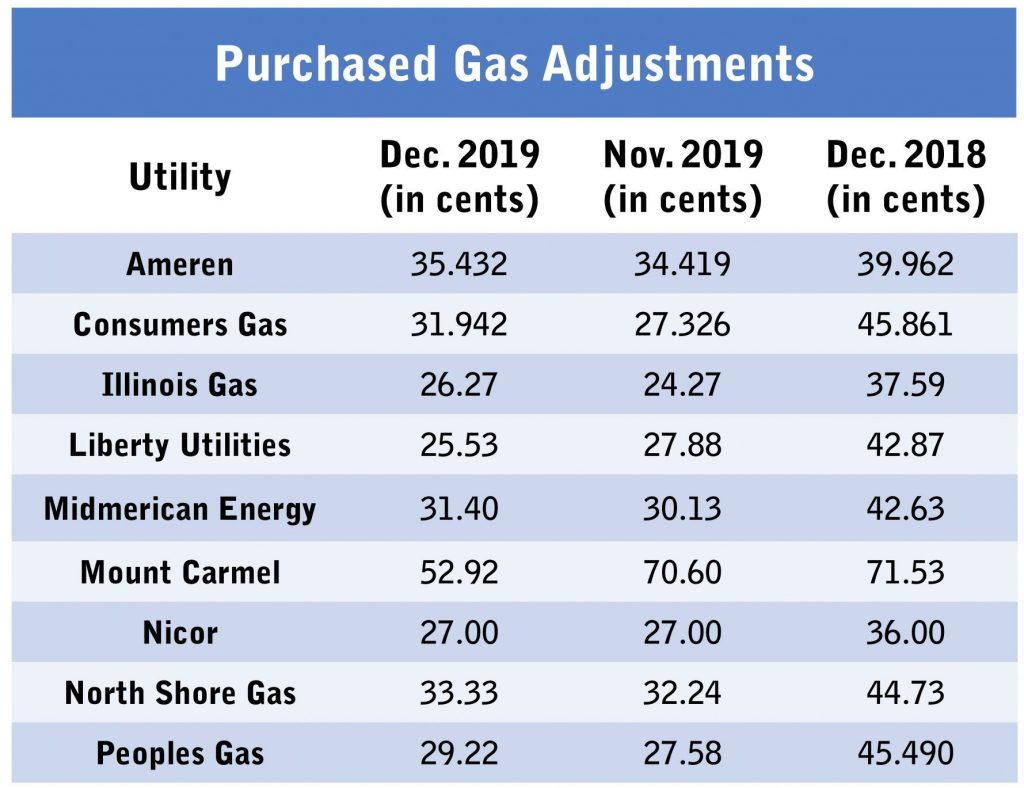
Financial experts often recommend using a moving average when planning for future expenses. If you look at the 2019 price of $2.60 and compare it to the volatility seen in 2022 and 2023, it becomes clear that fuel is a high-risk variable. To build a robust personal finance plan, you should not budget based on the “cheapest” months of a year. Instead, you should calculate your fuel budget based on the median price plus a 20% volatility buffer. This conservative approach prevents you from overextending your credit when global supply chains tighten.
Investment Implications: Energy Stocks and Wealth Building
The 2019 fuel market was not just a cost-of-living issue; it was a significant indicator for investors. Many individuals look to the energy sector as a hedge against inflation. During 2019, the energy sector provided a steady stream of dividends for those who incorporated oil and gas stocks into their portfolios.
Sector Stability vs. Growth
Investors who balanced their portfolios with energy equities in 2019 benefited from the sector’s predictable cash flow. When gas prices are stable—as they were in 2019—energy companies can forecast revenue with higher precision, leading to consistent dividend payouts. This period serves as a masterclass in why diversification is essential. While technology stocks may have offered higher growth, energy stocks provided the defensive stability that keeps a portfolio afloat during market corrections.
The Shift Toward Future-Proofing Assets
As we reflect on 2019, it is important to realize that the energy market is in a period of transition. The 2019 prices were reflective of an era dominated by traditional fossil fuels. Today, the savvy investor must weigh the historical stability of oil against the growing market share of electric vehicles (EVs) and renewable energy infrastructure. If your financial plan relies heavily on energy-sector dividends, 2019 provides a cautionary tale: market dominance is never permanent. As consumer behavior shifts, so too must your investment strategy.
Long-Term Financial Strategies Derived from Historical Data
Learning from 2019 is not about pining for “cheaper times,” but rather about learning how to build a resilient financial future that can withstand energy price shocks.
The Importance of Variable Expense Tracking
Most people track fixed expenses—rent, mortgage, and insurance—with ease. However, variable expenses like gas are often ignored until the end of the month when the bank statement shows an unexpected deficit. By reviewing your personal spending from 2019 and comparing it to your current spending, you can isolate how much of your “lost” savings is due to external economic factors versus lifestyle inflation.
Optimizing Your Commute and Asset Allocation
If 2019 taught us anything, it is that proximity to resources translates to wealth. Those who lived closer to their places of employment or had access to efficient public transit spent significantly less on fuel, allowing them to redirect those funds into high-yield savings accounts or retirement vehicles.
In your own financial journey, consider the “Gas Price Tax.” If you live 45 minutes from work, you are effectively paying a higher premium for your lifestyle every time the price per gallon fluctuates upward. When calculating the value of a new job or a new home, always incorporate the cost of the commute at its 90th percentile of expected price, not the national average.
Conclusion: Applying 2019 Lessons to Modern Finance
While the $2.60 per gallon average of 2019 may seem like a relic of a simpler time, the fundamental principles of the market remain unchanged. Supply chain stability, geopolitical influence, and domestic production continue to dictate the price you pay at the pump. By taking the data from 2019 and using it as a foundational benchmark, you can create a more resilient, better-calculated budget. Use the lessons of the past to protect your future purchasing power, ensuring that no matter how the energy market shifts, your personal financial health remains secure.
aViewFromTheCave is a participant in the Amazon Services LLC Associates Program, an affiliate advertising program designed to provide a means for sites to earn advertising fees by advertising and linking to Amazon.com. Amazon, the Amazon logo, AmazonSupply, and the AmazonSupply logo are trademarks of Amazon.com, Inc. or its affiliates. As an Amazon Associate we earn affiliate commissions from qualifying purchases.