
For investors, analysts, and casual observers alike, the daily closing number of the Dow Jones Industrial Average (DJIA) is more than just a figure on a screen; it is a pulse check for the American economy. When people ask, “What was the closing Dow Jones today?” they are participating in a ritual that dates back over a century. However, understanding the weight of that number requires a deep dive into what the index represents, how it is calculated, and how its daily fluctuations impact long-term financial strategies. In the world of personal finance and investing, the Dow serves as a psychological anchor and a benchmark for the health of large-cap, blue-chip companies that dominate the global marketplace.

The Anatomy of the Dow Jones Industrial Average
The Dow Jones Industrial Average is one of the oldest and most recognized stock market indices in the world. Established by Charles Dow and Edward Jones in 1896, it originally tracked only 12 industrial companies. Today, it has expanded to 30 prominent, publicly owned companies based in the United States. These companies are considered “blue-chip” leaders in their respective industries, ranging from technology and healthcare to finance and consumer goods.
The History and Evolution of the Index
The Dow was created to provide a simple, digestible snapshot of the stock market’s overall performance. In the late 19th century, information traveled slowly, and the average person had little way of knowing if the market was generally moving up or down. By averaging the stock prices of the most significant industrial firms—such as railroads and steel producers—Charles Dow gave the public a barometer for economic expansion.
Over the decades, the composition of the Dow has shifted to reflect the changing nature of the U.S. economy. Heavy industrial giants have often been replaced by tech titans and service-oriented conglomerates. For instance, companies like Apple, Microsoft, and Salesforce now sit alongside legacy names like Coca-Cola and JPMorgan Chase. This evolution ensures that the Dow remains a relevant indicator of the current economic landscape.
How the Dow is Calculated: Price-Weighted vs. Market Cap
One of the most critical aspects for an investor to understand is that the Dow is a price-weighted index. This distinguishes it from the S&P 500 or the Nasdaq, which are market-capitalization-weighted indices. In a price-weighted index, companies with higher stock prices have a greater influence on the index’s total value than companies with lower stock prices, regardless of the company’s total market value.
To keep the index consistent over time, especially during stock splits or mergers, the Dow uses a mathematical constant known as the “Dow Divisor.” This divisor is adjusted whenever a component company undergoes a structural change that affects its share price. Because of this weighting method, a $5 move in a high-priced stock like UnitedHealth Group will move the Dow significantly more than a $5 move in a lower-priced stock like Verizon, even if Verizon has a higher total market capitalization.
Interpreting the Daily Closing Bell
When the 4:00 PM EST bell rings on the floor of the New York Stock Exchange, the closing value of the Dow is finalized. This number is broadcast globally, often sparking immediate reactions in the futures markets and influencing the opening of international exchanges. For the individual investor, interpreting this daily closing price requires looking beyond the raw points and understanding the underlying percentages and market sentiment.
The Psychology of Market Fluctuations
The Dow is often subject to “market noise.” On any given day, the index might swing hundreds of points based on a single news headline, a geopolitical event, or a localized earnings report. It is easy for retail investors to fall into the trap of emotional trading when they see a sharp decline at the close. However, the Dow’s closing number is often a reflection of investor sentiment rather than fundamental changes in business value.
Successful investors distinguish between “volatility” and “risk.” Volatility is the daily fluctuation of the Dow, while risk is the permanent loss of capital. A 300-point drop in the Dow might look intimidating on a news ticker, but in percentage terms, it may represent less than a 1% change. Tracking the index over weeks, months, and years provides a much clearer picture of economic health than focusing on a single day’s closing bell.
Identifying Bull and Bear Market Trends
While a single day’s performance is a snapshot, the cumulative closing prices of the Dow help define market cycles. A “bull market” is generally defined by a 20% rise from recent lows, signaling optimism and economic growth. Conversely, a “bear market” occurs when the Dow drops 20% or more from its recent highs, often accompanied by recessionary fears.
Investors use the closing prices to plot moving averages—such as the 50-day or 200-day moving average. These technical indicators help analysts determine if the current market trend is sustainable or if a reversal is imminent. When the Dow consistently closes above its 200-day moving average, it is often seen as a sign of long-term upward momentum, providing confidence for those looking to increase their market exposure.
Key Factors Influencing the Dow’s Performance
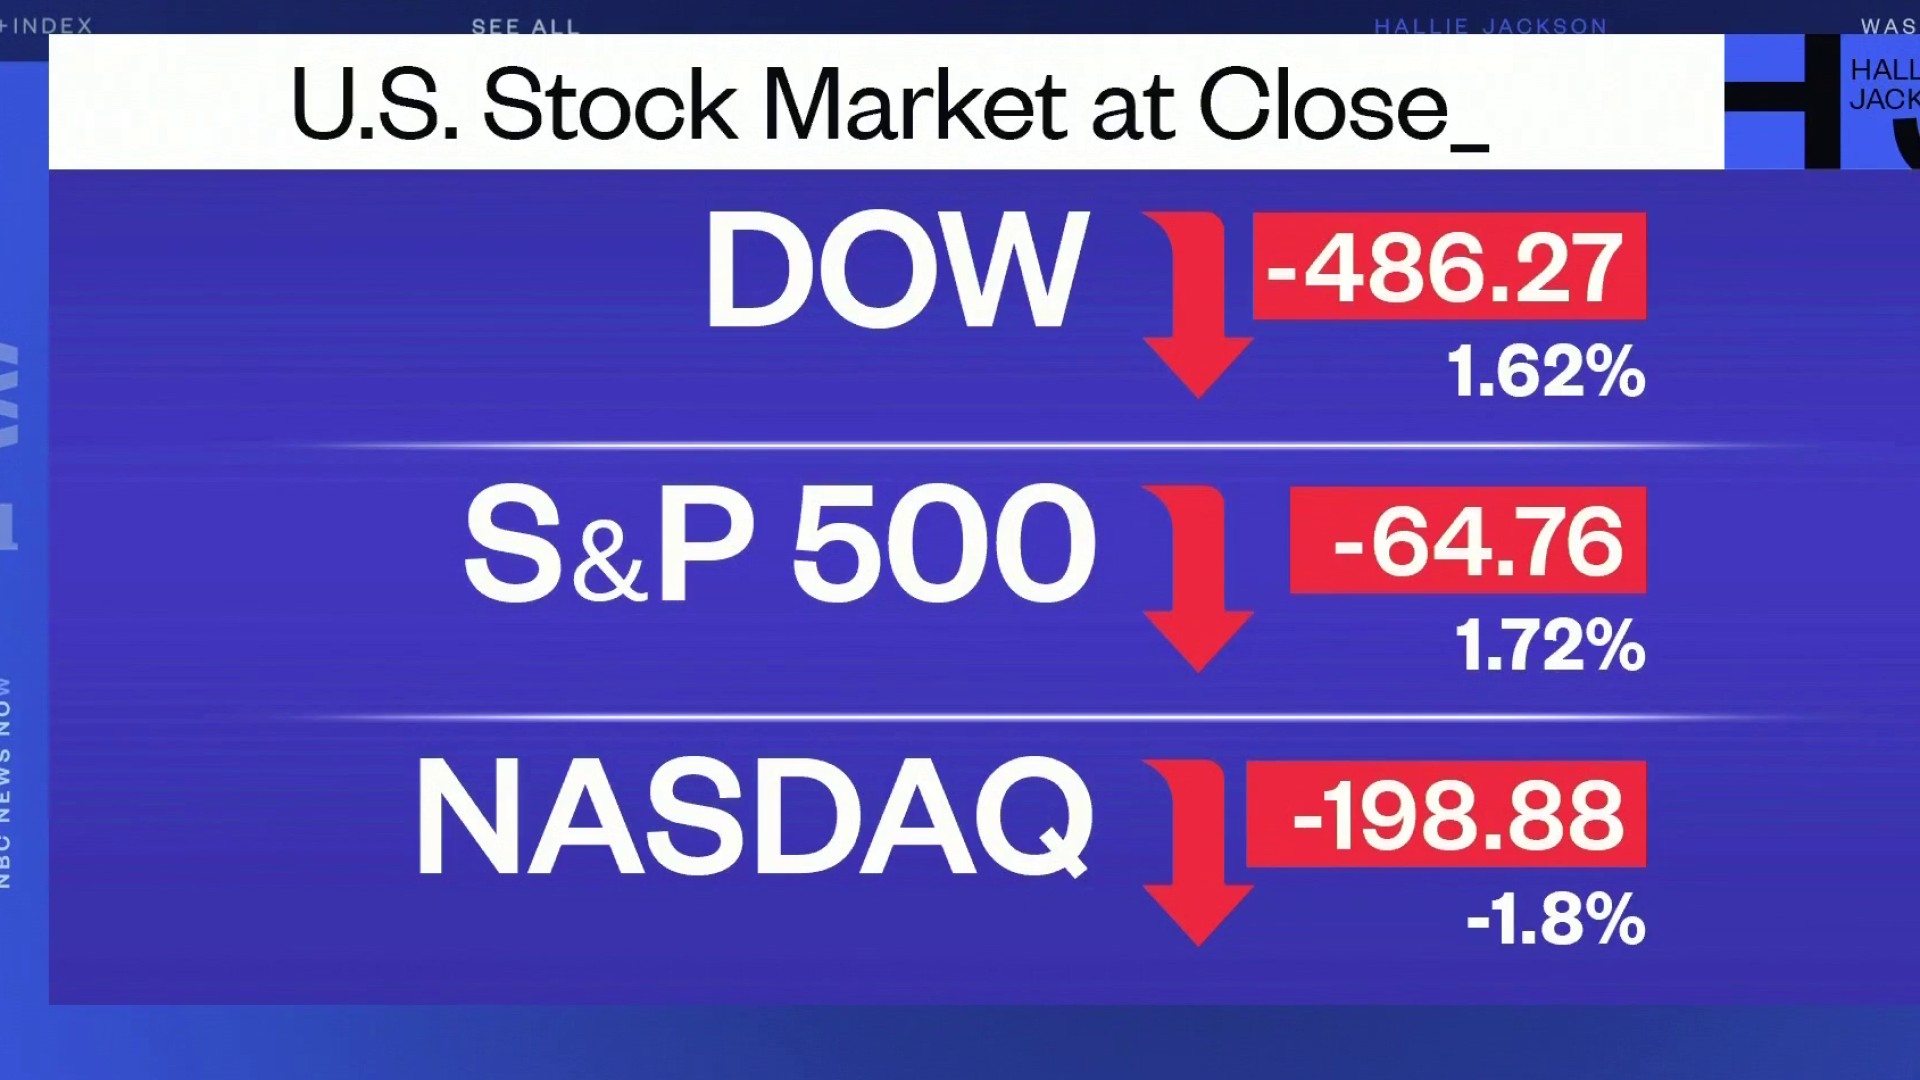
The daily closing price of the Dow is influenced by a complex web of internal and external factors. Understanding these variables can help investors anticipate market movements and adjust their portfolios accordingly.
Macroeconomic Indicators: Inflation and Interest Rates
Perhaps the most significant driver of the Dow in the modern era is the policy of the Federal Reserve. When the Fed raises interest rates to combat inflation, it typically exerts downward pressure on the Dow. Higher rates increase borrowing costs for the 30 companies in the index, which can squeeze profit margins and slow down expansion.
Conversely, when inflation is stable and interest rates are low, the Dow often experiences sustained growth. Investors look to the monthly Consumer Price Index (CPI) reports and unemployment data to guess how the Fed will move. A “better-than-expected” inflation report can lead to a massive rally in the Dow as traders bet on a more accommodative monetary policy.
Corporate Earnings and Sector Performance
Since the Dow consists of only 30 companies, the individual earnings reports of these giants have a disproportionate impact on the index. “Earnings season”—the period following each quarter when companies release their financial results—is a high-volatility time for the Dow. If a heavyweight like Goldman Sachs or Boeing reports a significant miss in revenue or lowers its future guidance, it can drag the entire index down, even if the other 29 companies are performing well.
Furthermore, the Dow is sensitive to sector-specific trends. Because it includes companies from sectors like energy, financials, and consumer staples, it serves as a microcosm of the broader corporate world. For example, a surge in global oil prices will typically boost the Dow’s energy components, such as Chevron, while potentially hurting its consumer-discretionary components due to higher transportation and energy costs.
The Role of the Dow in a Modern Investment Strategy
In an era of high-frequency trading and complex derivatives, some argue that the Dow Jones Industrial Average is an outdated metric. However, for the majority of investors, the Dow remains a cornerstone of a balanced financial strategy. Its focus on established, dividend-paying companies makes it an attractive benchmark for those seeking stability and long-term wealth accumulation.
Diversification Beyond the 30 Industrials
While the Dow is a great indicator of large-cap health, a well-rounded portfolio must look beyond these 30 companies. Relying solely on the Dow would mean missing out on the explosive growth of small-cap companies (represented by the Russell 2000) or the broader diversification of the S&P 500.
Financial advisors often suggest using the Dow as the “value” or “stability” portion of a portfolio. Because the DJIA components are “mature” companies, they are less likely to experience the 50% or 80% drawdowns seen in speculative tech stocks. Instead, they offer consistent dividends and steady, albeit slower, growth.
Using Index Funds and ETFs to Track the DJIA
For investors who want their portfolio to mirror the Dow’s performance, Exchange-Traded Funds (ETFs) provide an easy entry point. The most famous of these is the SPDR Dow Jones Industrial Average ETF Trust, known by its ticker symbol “DIA” (or “the Diamonds”). By purchasing shares of this ETF, an investor gains exposure to all 30 companies in the Dow in a single transaction.
This approach is highly effective for passive investors who subscribe to the “Dogs of the Dow” strategy. This popular investment theory suggests that at the beginning of each year, an investor should buy the ten stocks in the Dow with the highest dividend yields. The premise is that these companies are temporarily undervalued and will likely see a price correction (increase) in the coming year while providing steady income through dividends.
Navigating Volatility: The Importance of Long-Term Wealth Building
At the end of the day, the answer to “What was the closing Dow Jones today?” should be treated as a single data point in a much larger narrative. Investing is a marathon, not a sprint. The Dow has survived world wars, depressions, pandemics, and technological revolutions. In every instance, despite temporary crashes, it has eventually climbed to new record highs.
The Power of Compound Growth
The real secret to utilizing the information provided by the Dow is the power of time. An investor who started tracking the Dow in the 1980s saw it cross 1,000, then 10,000, and eventually 30,000 points. Those who panicked during the 2008 financial crisis or the 2020 pandemic lockdowns missed out on the subsequent recoveries that saw the index reach unprecedented levels.
By staying invested and reinvesting dividends, the fluctuations of the closing price become secondary to the accumulation of shares. Dollar-cost averaging—the practice of investing a fixed amount of money at regular intervals regardless of the Dow’s closing price—remains one of the most effective ways to build wealth. This strategy ensures that you buy more shares when the Dow is “on sale” (down) and fewer shares when it is expensive (up).

Conclusion: Looking Beyond the Ticker
The Dow Jones Industrial Average is a historical monument and a living, breathing financial entity. While its daily closing number dominates financial news cycles, its true value lies in what it represents: the resilience and productivity of the American corporate engine. By understanding the mechanics of the index and the factors that move it, investors can move from a place of uncertainty to a place of informed, strategic decision-making. Whether the Dow closes up 200 points or down 500 today, the disciplined investor remains focused on the horizon, knowing that the “blue chips” of today are the foundations of the wealth of tomorrow.
aViewFromTheCave is a participant in the Amazon Services LLC Associates Program, an affiliate advertising program designed to provide a means for sites to earn advertising fees by advertising and linking to Amazon.com. Amazon, the Amazon logo, AmazonSupply, and the AmazonSupply logo are trademarks of Amazon.com, Inc. or its affiliates. As an Amazon Associate we earn affiliate commissions from qualifying purchases.