
In the global financial ecosystem, few commodities carry as much weight or volatility as crude oil. Often referred to as the lifeblood of the global economy, the price of oil per barrel serves as a primary barometer for economic health, inflationary pressure, and geopolitical stability. For investors, business owners, and financial analysts, understanding how these prices are determined, why they fluctuate, and how to track them is essential for navigating modern markets.
The price of oil is not a singular, static figure. Instead, it is a dynamic value influenced by a complex interplay of supply chain logistics, speculative trading, and macroeconomic policy. To understand what determines the price of a barrel, one must first look at the benchmarks that define the market.
Decoding the Benchmarks: Brent vs. WTI
When a financial news outlet reports on the current price of oil, they are typically referring to one of two primary benchmarks: West Texas Intermediate (WTI) or Brent Crude. These benchmarks act as reference points for buyers and sellers across the globe, allowing for standardized trading despite the varying quality and location of oil reserves.
West Texas Intermediate (WTI)
WTI is the primary benchmark for oil produced in the United States, specifically from the Permian Basin and other domestic fields. It is characterized as a “light, sweet” crude. The term “light” refers to its low density, which makes it easier to process into gasoline and diesel, while “sweet” indicates a low sulfur content. Because it is refined largely in the U.S. Midwest and Gulf Coast, its price is heavily influenced by domestic inventory levels, particularly those at the storage hub in Cushing, Oklahoma.
Brent Crude
Brent Crude serves as the international benchmark, sourced primarily from the North Sea. It is also a light, sweet crude, though slightly less so than WTI. Brent is the pricing standard for approximately two-thirds of the world’s internationally traded crude oil. Because it is waterborne, Brent is more easily transported to global markets, making it highly sensitive to international geopolitical events and shipping lane security.
Understanding the Spread
The price difference between WTI and Brent is known as the “spread.” Historically, WTI often traded at a premium to Brent, but in the modern era, Brent typically trades higher. This spread is a vital indicator for energy investors; a widening spread can indicate an oversupply in the U.S. or a supply disruption in Europe or the Middle East. Tracking this differential allows traders to identify arbitrage opportunities and assess the efficiency of global distribution networks.
The Economic Drivers of Oil Pricing
The fundamental principle of supply and demand remains the primary driver of oil prices, but the factors influencing these forces are multi-faceted and often unpredictable.
The Role of OPEC and OPEC+
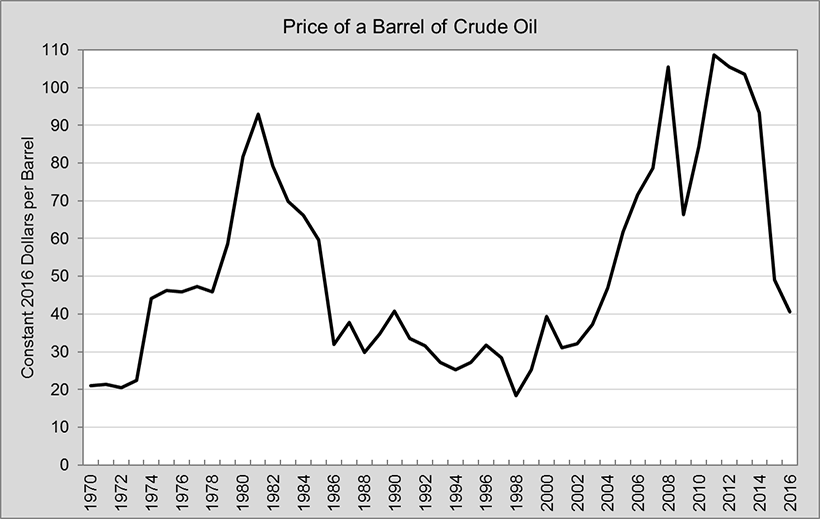
The Organization of the Petroleum Exporting Countries (OPEC), led by Saudi Arabia, along with its allies (collectively known as OPEC+), wields significant influence over global supply. By setting production quotas, these nations can effectively create a price floor or ceiling. When OPEC+ decides to cut production, the resulting decrease in supply usually drives the price per barrel upward. Conversely, a decision to “open the taps” can lead to a price collapse, as seen during market share wars.
Global Demand and Industrial Growth
On the demand side, oil prices are intrinsically linked to global GDP growth. During periods of economic expansion, particularly in emerging markets like China and India, the demand for energy to fuel manufacturing and transportation surges. In contrast, economic recessions lead to reduced industrial output and travel, causing prices to retreat. Analysts closely monitor the “Purchasing Managers’ Index” (PMI) and other industrial data to forecast future oil demand.
The Impact of the U.S. Dollar
Because oil is priced globally in U.S. Dollars (USD), there is an inverse relationship between the strength of the dollar and the price per barrel. When the USD strengthens against other major currencies, oil becomes more expensive for foreign buyers, which can dampen demand and lead to lower prices. When the dollar weakens, oil effectively becomes “cheaper” for international participants, often driving the price higher. This makes the U.S. Dollar Index (DXY) a critical tool for any oil-focused investment strategy.
Investing in Oil: Markets, Instruments, and Strategies
For those looking to capitalize on price movements, the financial markets offer several avenues for exposure. Investing in oil requires a nuanced understanding of “paper oil” (derivatives) versus “physical oil.”
Futures Contracts and the Forward Curve
Most institutional trading happens in the futures market. A futures contract is a legal agreement to buy or sell a barrel of oil at a predetermined price at a specified time in the future. These contracts allow producers to hedge against price drops and refineries to lock in costs.
Investors must understand two key market states:
- Contango: A situation where the future price of oil is higher than the current spot price. This often indicates a well-supplied market but can create “roll yield” losses for investors holding long-term positions.
- Backwardation: A situation where the current spot price is higher than future prices. This suggests tight supply and is generally viewed as a bullish signal for the commodity.
Exchange-Traded Funds (ETFs) and Energy Equities
For individual investors, direct participation in the futures market can be complex and risky. Instead, many turn to ETFs that track the price of oil or the performance of energy companies. Some ETFs hold futures contracts (like the United States Oil Fund, USO), while others invest in the “upstream” (exploration and production), “midstream” (pipelines and transport), or “downstream” (refining and marketing) sectors. Investing in integrated giants like ExxonMobil or Chevron provides exposure to oil prices while also offering dividends and the stability of diversified business models.
Hedging Strategies for Business Finance
Beyond speculation, the price of oil is a critical component of corporate financial planning. Airlines, logistics companies, and manufacturers often use financial tools to hedge their fuel costs. By locking in a price per barrel months or years in advance, these businesses protect their profit margins from sudden spikes in energy costs, ensuring operational stability regardless of market volatility.
Geopolitical Risks and the Energy Transition
The price of oil is perhaps more sensitive to geopolitical tension than any other asset class. Because a significant portion of the world’s oil is located in or transported through politically sensitive regions, “risk premiums” are frequently baked into the price.
Supply Disruptions and Strategic Reserves
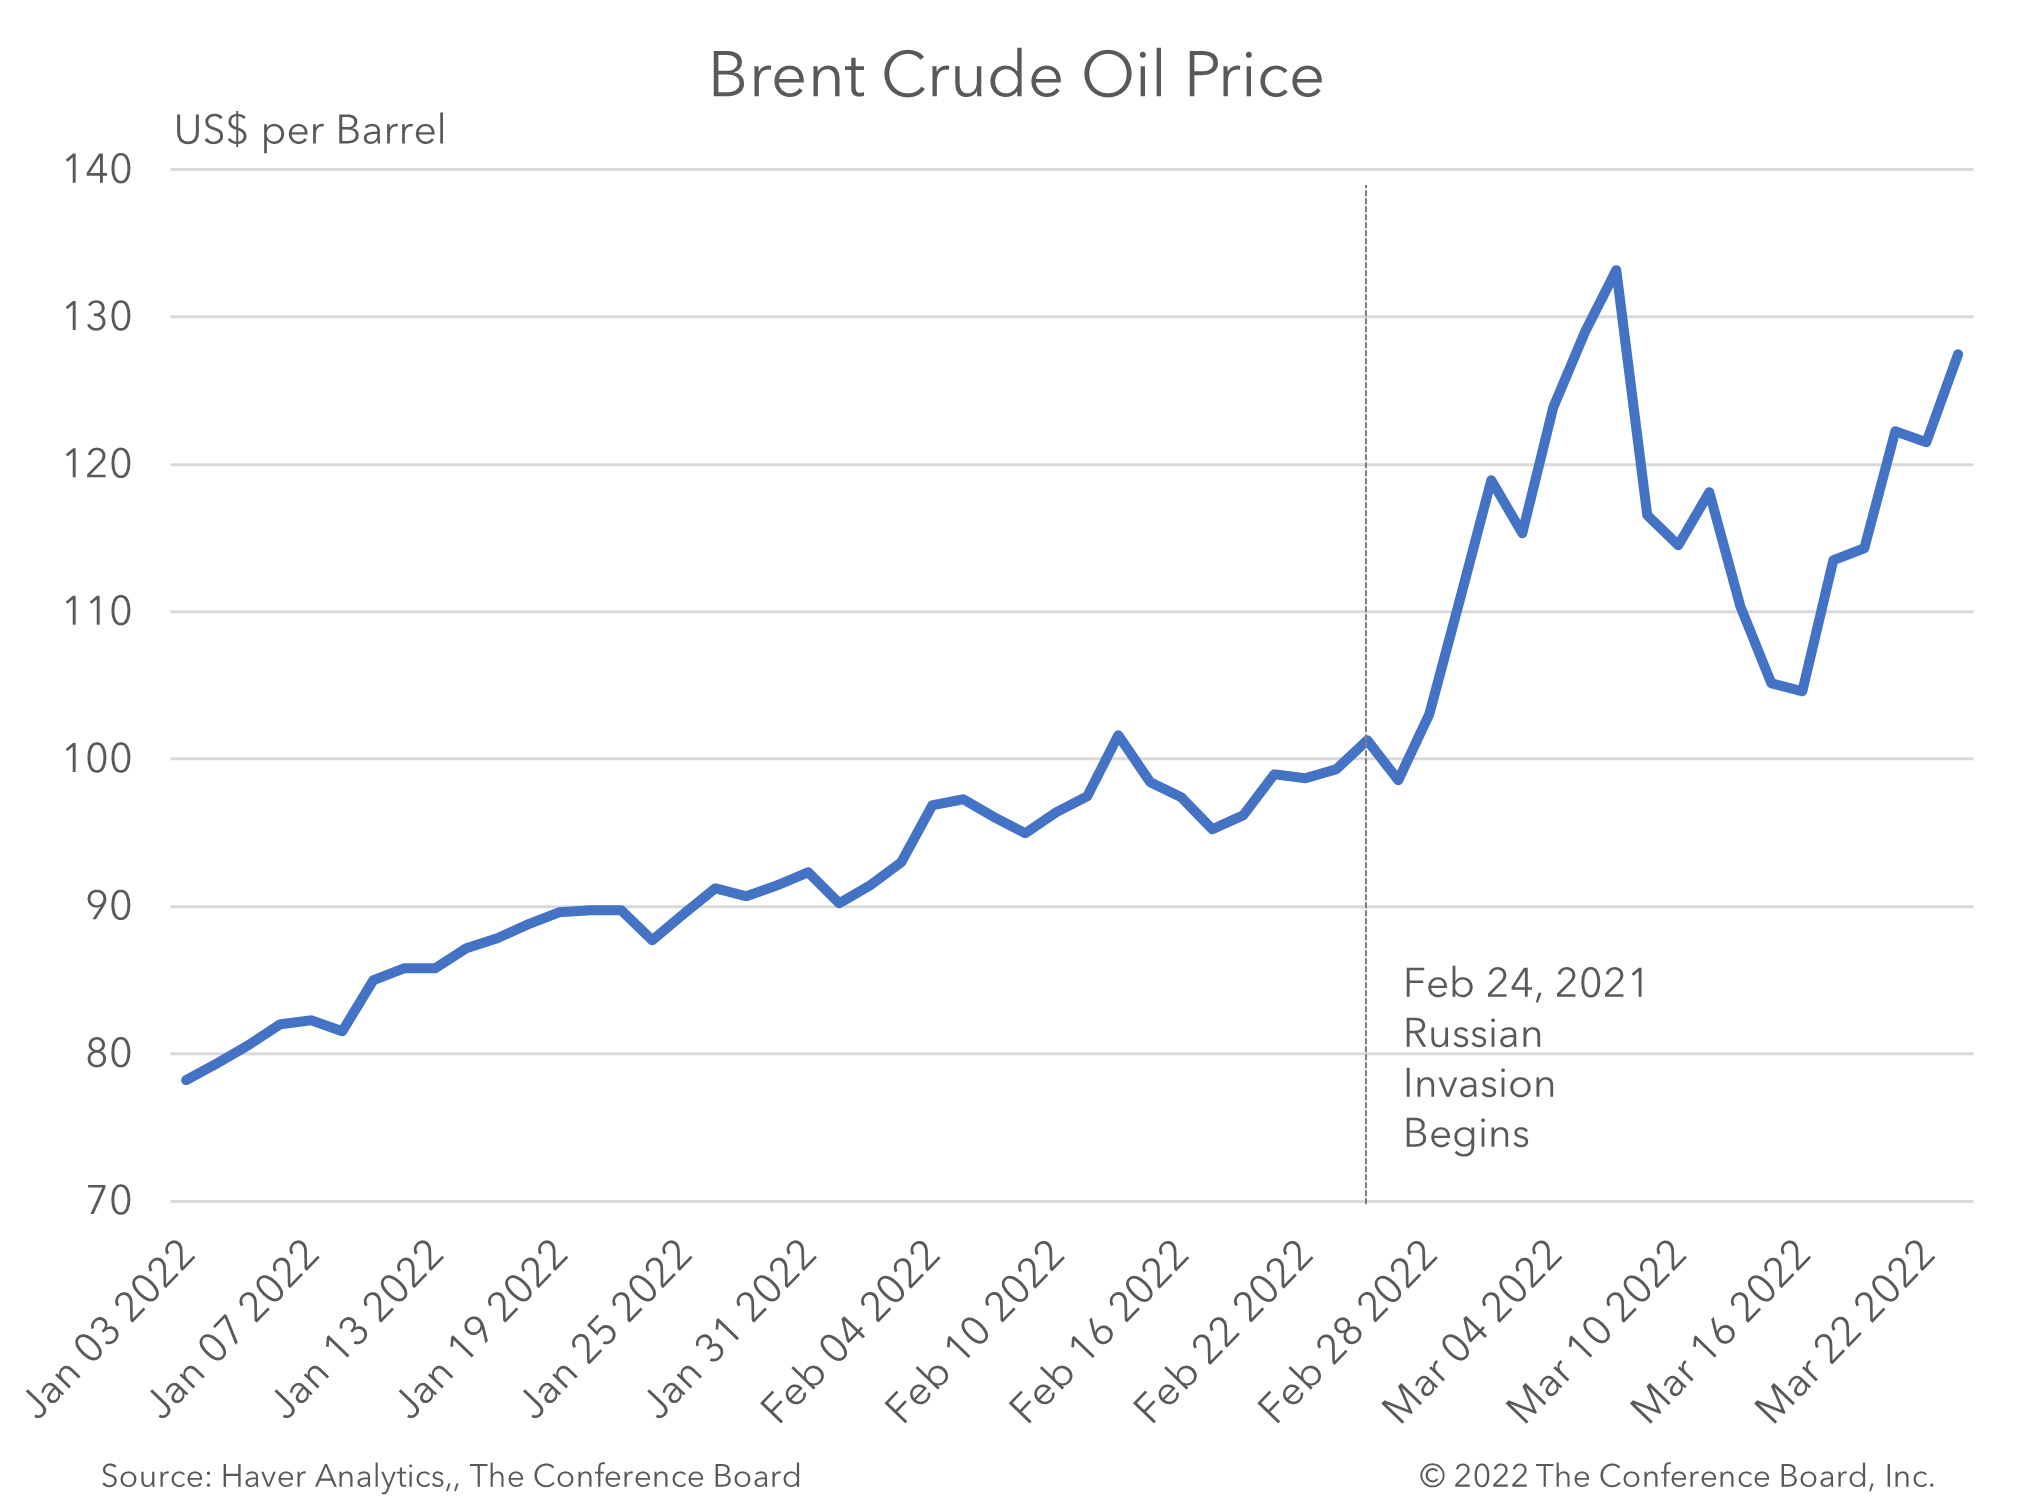
Conflicts in the Middle East, sanctions on major producers like Iran or Russia, and instability in South American producers like Venezuela can take millions of barrels off the market overnight. To combat this, many nations maintain Strategic Petroleum Reserves (SPR). The release of oil from these reserves is a tool used by governments to provide liquidity to the market and suppress rapid price increases during emergencies.
The Long-Term Outlook: Peak Oil and ESG
The global shift toward renewable energy and the rise of Electric Vehicles (EVs) have introduced a new variable: the “Energy Transition.” Investors are increasingly focused on Environmental, Social, and Governance (ESG) criteria, which can limit capital flow into new oil exploration projects. This lack of investment in “new oil” could paradoxically lead to higher prices in the medium term due to supply shortages, even as long-term demand is projected to plateau. The concept of “Peak Oil”—the point at which global oil consumption begins a terminal decline—is a subject of intense debate among financial analysts, as it will ultimately determine the terminal value of energy assets.
Financial Tools for Real-Time Price Monitoring
In a market that operates 24 hours a day, having access to accurate data is paramount. Professional traders utilize a variety of tools to track the price of oil and its underlying drivers.
Technical Analysis and Indicators
Traders often use technical indicators to predict price movements. Moving averages (such as the 50-day and 200-day) help identify long-term trends, while the Relative Strength Index (RSI) can indicate whether oil is “overbought” or “oversold.” Volume analysis is also crucial; high trading volume during a price increase suggests strong conviction among market participants.

Fundamental Data Reports
Every week, the Energy Information Administration (EIA) releases the “Weekly Petroleum Status Report,” which details U.S. crude oil inventory levels. If inventories are lower than expected, it typically suggests high demand or low supply, causing prices to rise. Similarly, the International Energy Agency (IEA) and OPEC release monthly reports that provide global perspectives on production and consumption forecasts. For any serious investor, these reports are required reading.
By understanding the intricacies of benchmarks, the mechanics of supply and demand, and the instruments available for investment, one can move beyond simply asking “what price is oil” to understanding the “why” behind the number. In the world of finance, that understanding is the difference between speculative gambling and informed, strategic investing.
aViewFromTheCave is a participant in the Amazon Services LLC Associates Program, an affiliate advertising program designed to provide a means for sites to earn advertising fees by advertising and linking to Amazon.com. Amazon, the Amazon logo, AmazonSupply, and the AmazonSupply logo are trademarks of Amazon.com, Inc. or its affiliates. As an Amazon Associate we earn affiliate commissions from qualifying purchases.