
The American tax system is one of the most complex financial structures in the world, often leading to significant public debate regarding fairness, sustainability, and economic impact. One of the most frequently cited and misunderstood statistics in personal finance is the percentage of U.S. citizens who pay no federal income tax. While the “47 percent” figure became a viral political talking point years ago, the actual data fluctuates based on economic conditions, legislative changes, and shifting demographic trends. To understand your own financial position and the broader health of the U.S. economy, it is essential to dive deep into the mechanics of who pays, who doesn’t, and why.
The Reality of Federal Income Tax Liability
When we discuss the percentage of Americans who do not pay federal income tax, it is vital to distinguish between “federal income tax” and “total federal taxes.” A common misconception is that a significant portion of the population contributes nothing to the federal coffers. In reality, the tax landscape is multifaceted.
The Distinction Between Income Tax and Payroll Tax
Many individuals who owe zero dollars in federal income tax at the end of the year still contribute significantly through payroll taxes. These are the FICA (Federal Insurance Contributions Act) taxes that fund Social Security and Medicare. Even if an individual’s earnings are low enough that their income tax liability is wiped out by deductions and credits, they usually still see deductions from their paycheck for these social insurance programs. Consequently, the group of Americans who pay no federal taxes of any kind is much smaller than the group that pays no income tax.
Who are the “Non-Payers”?
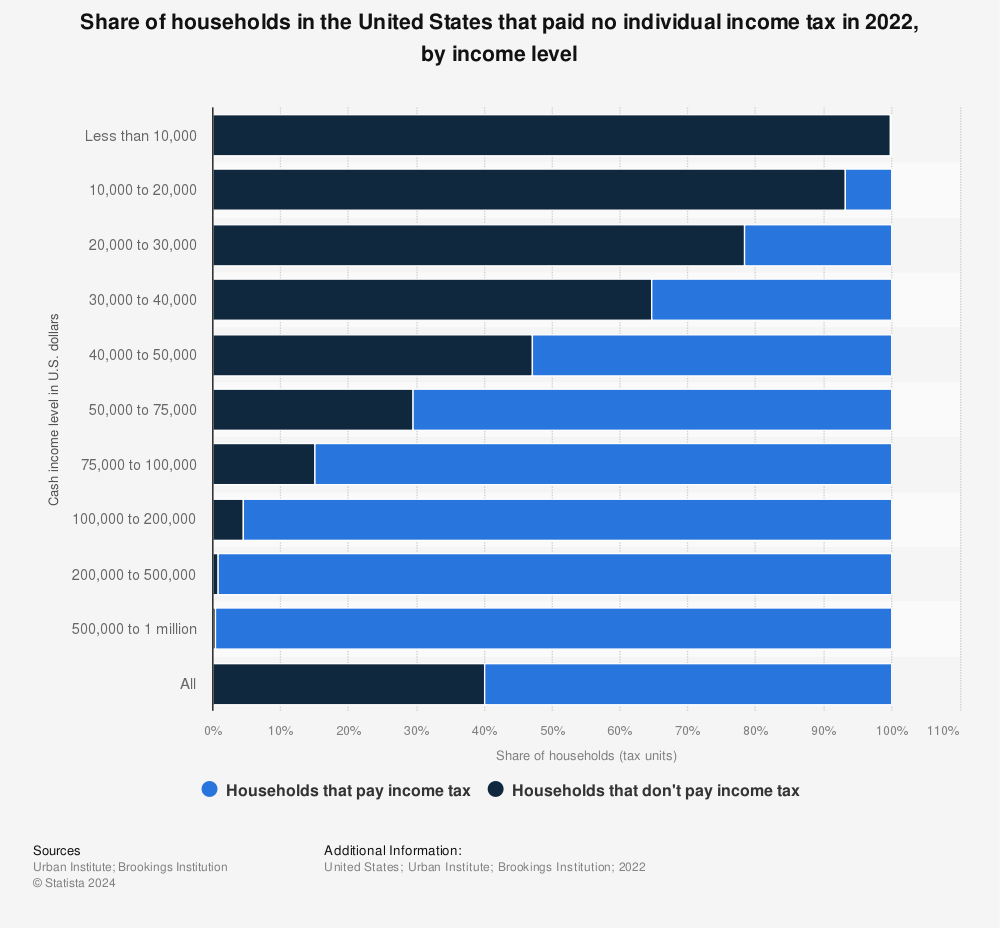
The group often referred to as “non-payers” typically falls into two primary categories: those whose income is below the standard deduction threshold and those whose tax credits exceed their tax liability. This group includes a large number of retirees living on Social Security, low-income workers, and students. By understanding that “zero tax liability” is often a result of targeted policy decisions rather than tax evasion, we gain a clearer picture of the American financial ecosystem.
Breaking Down the Numbers: Why 40% to 60% Pay Zero
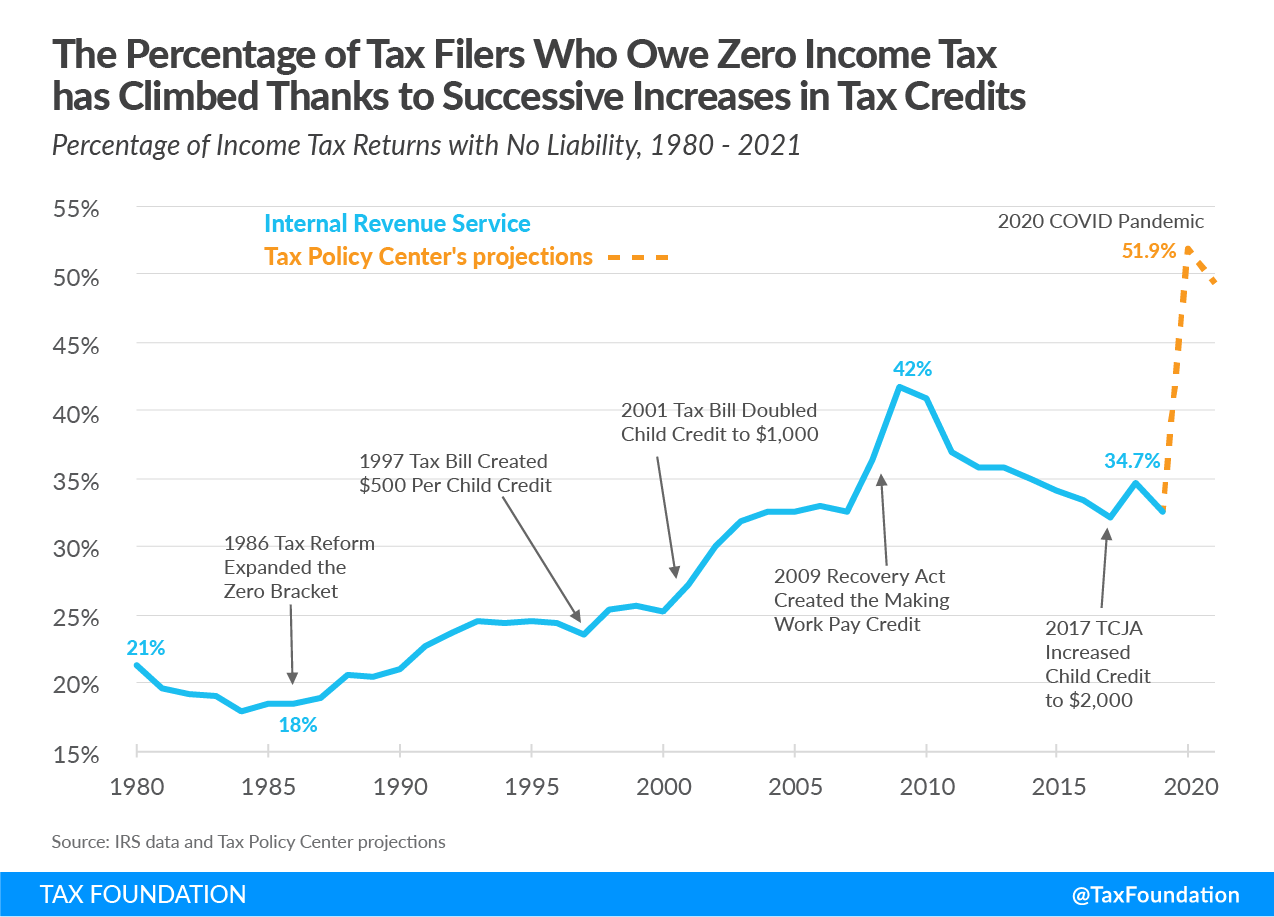
Statistical data from the Tax Policy Center and the Tax Foundation reveals that the percentage of households paying no federal income tax has seen dramatic shifts over the last decade. Historically, this number hovered around 40%. However, global events and legislative responses have caused temporary spikes that altered the financial landscape.
Historical Trends and Recent Fluctuations
In 2020 and 2021, the percentage of Americans paying no federal income tax spiked to approximately 60%. This was not a permanent shift in the tax code but a direct result of the economic fallout from the COVID-19 pandemic. Massive unemployment, coupled with multiple rounds of stimulus checks and expanded tax credits, effectively eliminated the income tax liability for millions of households. As the economy recovered and pandemic-era provisions expired, this number began to trend back down toward the historical average of 40% to 45%.
The Impact of Tax Credits (CTC and EITC)
The primary drivers behind a zero-tax balance for many households are “refundable” tax credits. The Earned Income Tax Credit (EITC) and the Child Tax Credit (CTC) are designed to provide financial relief to working-class families. Because these credits are refundable, they can do more than just bring a tax bill to zero; they can actually result in the government sending a check to the filer. From a personal finance perspective, these credits serve as a form of social safety net delivered through the tax code, significantly reducing the poverty rate among working families.
The Role of the Standard Deduction and Tax Brackets
The mechanism that keeps many Americans off the tax rolls is the progressive nature of the U.S. tax system. This system is built on the principle that those with a greater ability to pay should shoulder a larger portion of the tax burden, while those at the lower end of the spectrum should be protected from financial hardship.
Progressivity in the U.S. Tax System
The U.S. uses a marginal tax bracket system, where higher levels of income are taxed at higher percentages. However, before those brackets even apply, the “Standard Deduction” acts as a shield. For the 2024 tax year, the standard deduction for a single filer is $14,600, and $29,200 for married couples filing jointly. This means a single person earning $14,000 a year effectively has a taxable income of zero. This is a foundational element of U.S. financial policy, ensuring that subsistence-level income is not depleted by federal taxes.
Why Low Earners Are Excluded
Beyond the standard deduction, the exclusion of low earners from the federal income tax roll is a deliberate economic strategy. By allowing low-income households to retain 100% of their earnings (minus payroll taxes), the government encourages labor force participation and ensures that these individuals have more disposable income to spend on basic necessities. From a macroeconomic standpoint, this spending stimulates local economies, as lower-income tiers tend to have a higher “marginal propensity to consume.”
Economic Implications of a Large Non-Paying Base
The fact that a large percentage of the population does not pay federal income tax is often a point of contention among economists and financial analysts. This phenomenon has both positive and negative implications for the nation’s long-term financial health.
Tax Base Sustainability
One of the primary concerns for financial planners and policy makers is the “narrowing” of the tax base. When a smaller percentage of the population (the top 10% or 20%) pays the vast majority of the total federal income tax revenue, the system becomes highly sensitive to the economic fortunes of that specific group. If the wealthy experience a downturn, federal revenues can crater. Critics argue that having “skin in the game” for a broader segment of the population would create more fiscal accountability, while proponents argue that the current system is the only way to prevent widening wealth inequality.
Consumer Spending vs. Government Revenue
From a “Money” perspective, the trade-off is between government revenue and consumer spending. Every dollar not collected in taxes from a low- or middle-income household is a dollar that likely goes back into the economy through the purchase of goods and services. This supports businesses, drives corporate profits, and eventually leads to tax revenue via corporate taxes and capital gains. However, this must be balanced against the government’s need to fund infrastructure, defense, and social programs, which requires a consistent and robust stream of income tax.
Planning for the Future: What Taxpayers Need to Know
Whether you currently pay federal income tax or fall into the percentage that does not, understanding the trajectory of tax law is essential for long-term wealth management and personal financial planning.
Legislative Changes on the Horizon
Tax laws are never static. The Tax Cuts and Jobs Act (TCJA) of 2017, which significantly increased the standard deduction and modified tax brackets, is set to expire at the end of 2025. Unless Congress acts, many of the provisions that currently keep the “non-paying” percentage high will revert to older, less generous standards. This could mean that millions of people who currently have zero tax liability may find themselves owing money in the near future. Financial literacy involves preparing for these shifts by adjusting withholdings and retirement contributions accordingly.

Managing Your Personal Tax Liability
For those looking to optimize their financial life, the goal is often to legally minimize tax liability. This involves more than just hoping to fall into the “zero-pay” category; it involves proactive strategies.
-
Retirement Contributions: Contributing to a 401(k) or Traditional IRA reduces your Adjusted Gross Income (AGI), potentially dropping you into a lower bracket or making you eligible for credits you might otherwise miss.
-
Health Savings Accounts (HSA): These offer a triple tax advantage and are an excellent tool for reducing taxable income.
-
Understanding Credits: Knowing the difference between a deduction (which lowers taxable income) and a credit (which lowers the tax bill dollar-for-dollar) is crucial for effective tax planning.
In conclusion, while it is true that a significant percentage—roughly 40% to 45% in a typical year—of U.S. citizens pay no federal income tax, this is a calculated outcome of a progressive fiscal policy. It reflects the use of the tax code as a tool for social engineering and economic stimulus. For the individual, understanding these percentages isn’t just about trivia; it’s about recognizing how the mechanics of the U.S. financial system affect personal cash flow, investment strategies, and the broader economic environment in which we all operate.
aViewFromTheCave is a participant in the Amazon Services LLC Associates Program, an affiliate advertising program designed to provide a means for sites to earn advertising fees by advertising and linking to Amazon.com. Amazon, the Amazon logo, AmazonSupply, and the AmazonSupply logo are trademarks of Amazon.com, Inc. or its affiliates. As an Amazon Associate we earn affiliate commissions from qualifying purchases.