
In the world of personal finance, data is your most powerful asset. Whether you are tracking your monthly spending, analyzing investment portfolio returns, or calculating the average performance of a side hustle, raw numbers can be overwhelming. To make sense of the chaos, you need descriptive statistics. The four fundamental pillars of data analysis—mean, median, mode, and range—provide a lens through which you can view your financial health with clarity and precision. By mastering these concepts, you transition from simply “tracking” your money to strategically managing it.

The Mean: Understanding Your Averages
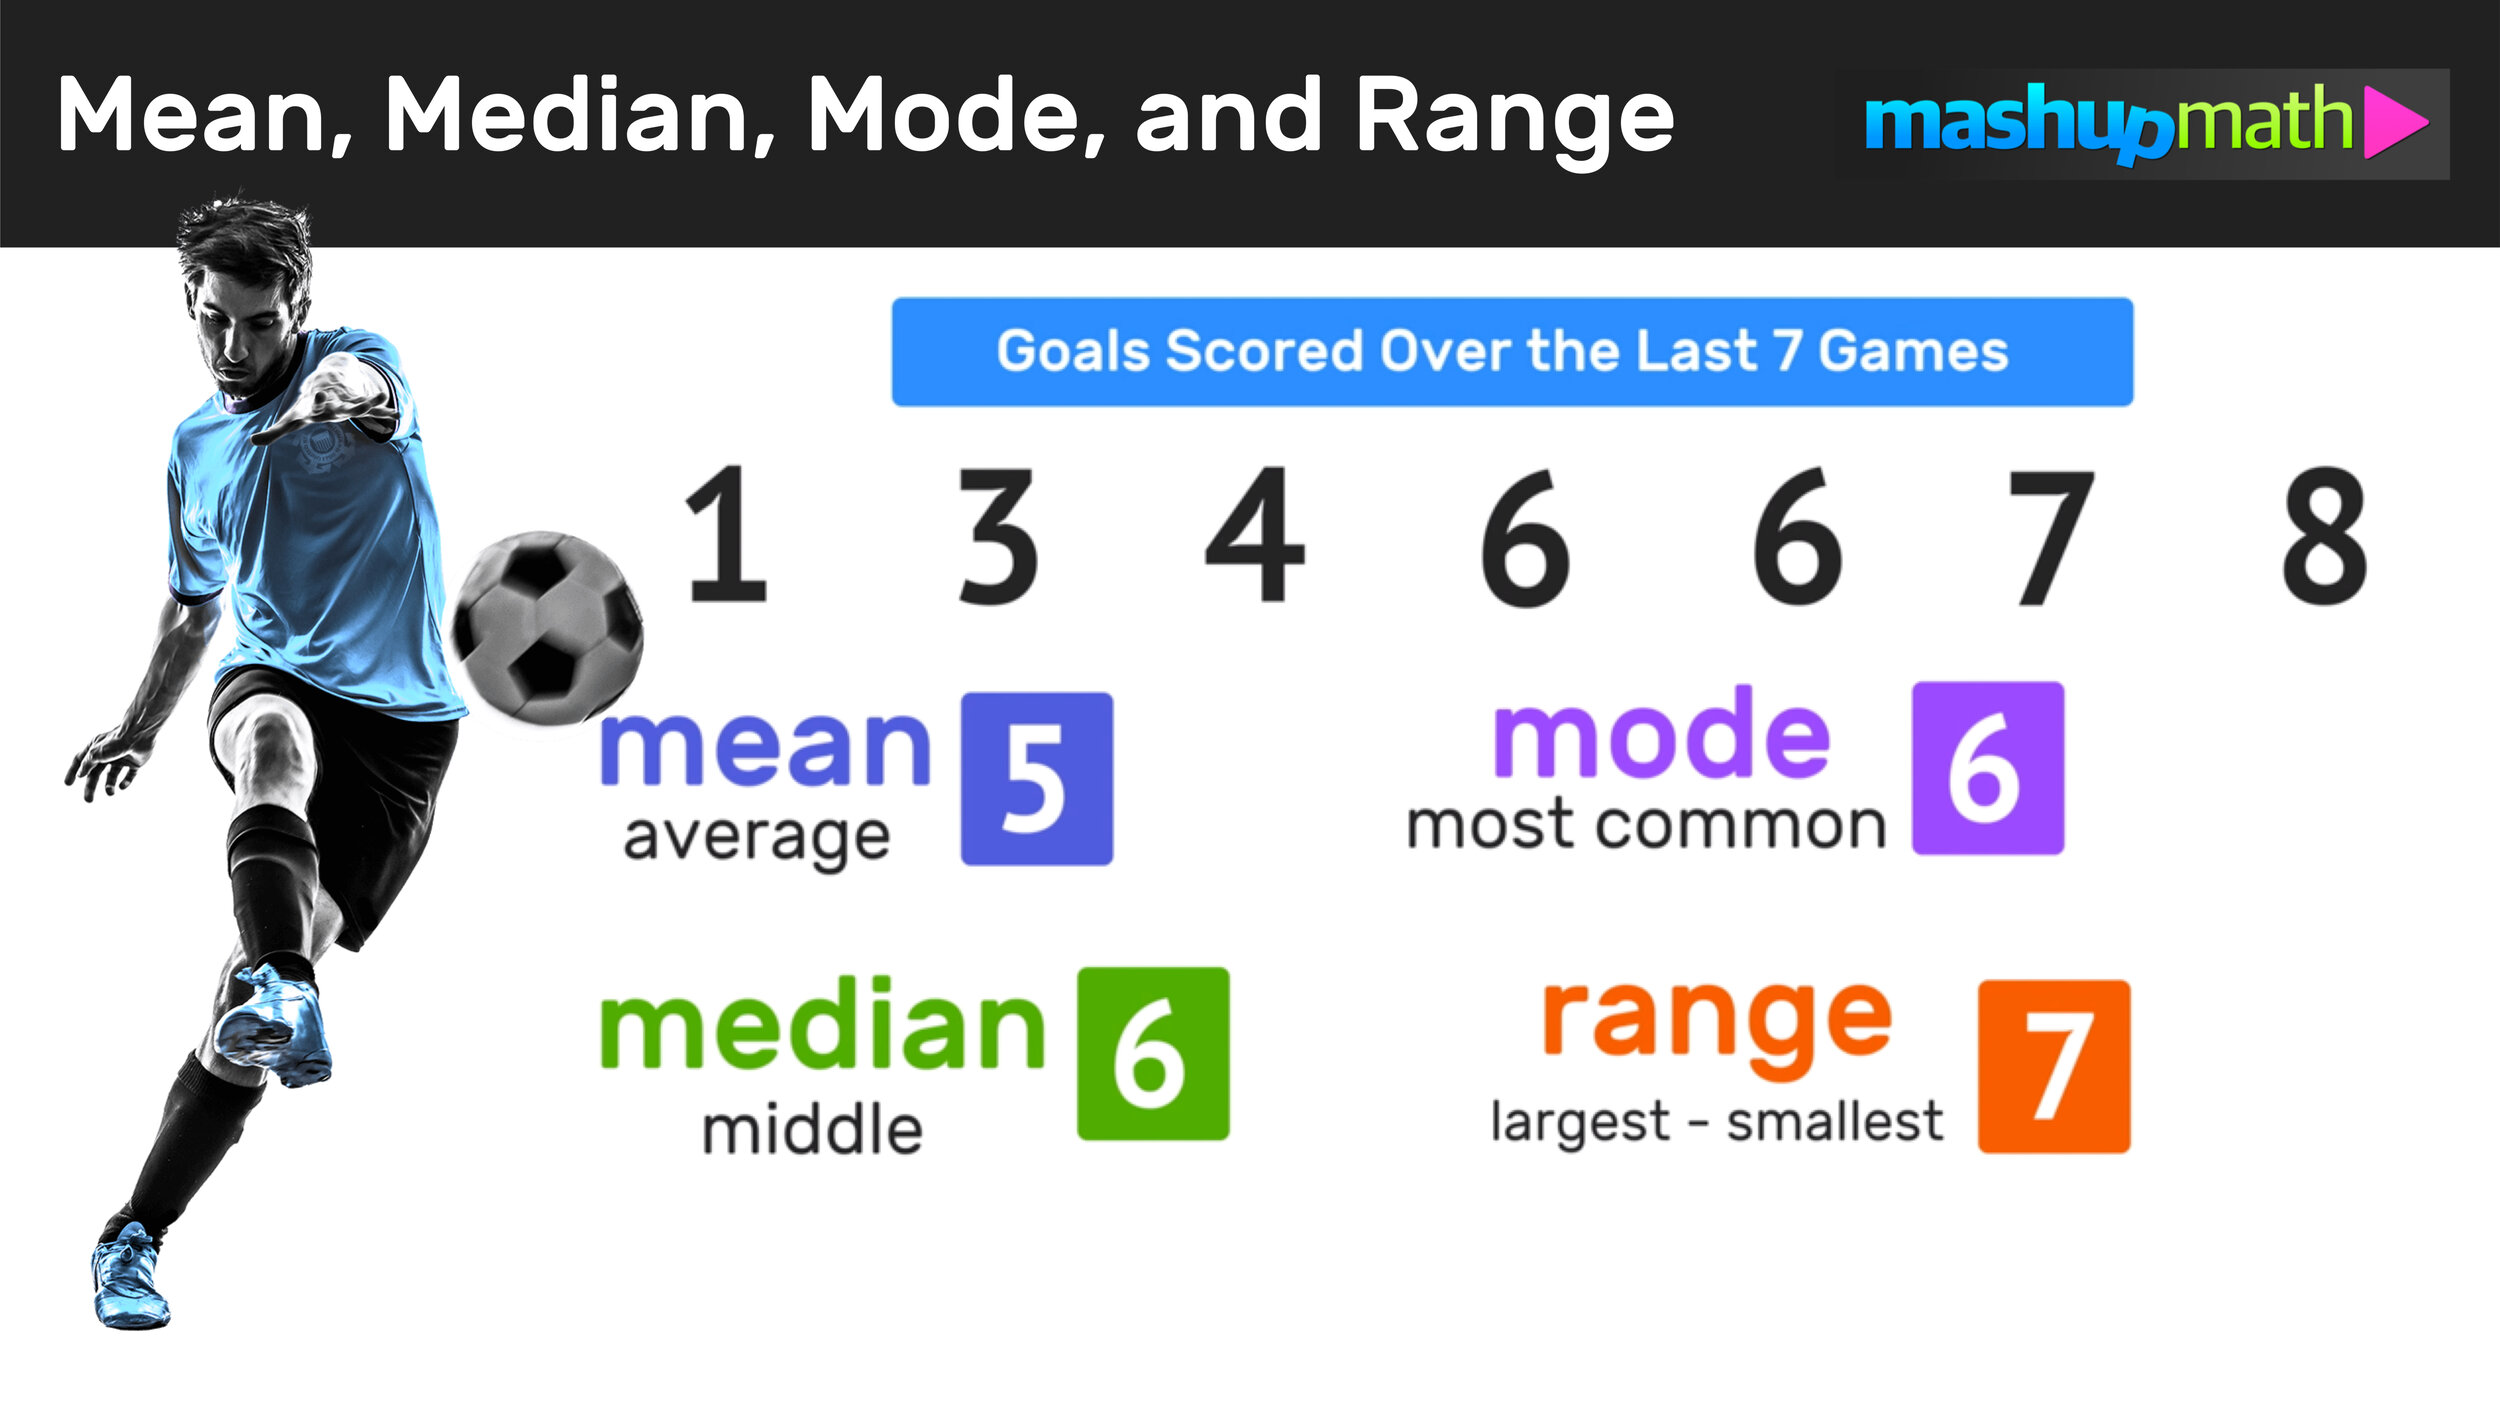
The mean, commonly known as the average, is the most frequently used statistical tool in finance. It is calculated by summing all the values in a dataset and dividing that sum by the number of entries. In a personal finance context, the mean serves as a benchmark for your recurring habits.
Calculating Monthly Spending Patterns
To calculate your average monthly grocery bill, you would add your spending for the last twelve months and divide by twelve. This figure provides a baseline expectation for your budget. If your mean grocery spend is $600, you have a solid number to allocate in your budgeting app.
The Limitations of the Mean
While the mean is useful, it is highly sensitive to outliers—extreme values that can skew your perception of reality. For example, if you spend $400 on groceries for eleven months, but one month you spend $2,000 for a major holiday gathering, your mean will jump significantly. This inflated mean might lead you to believe you are spending more than you typically do, causing unnecessary stress. Recognizing when the mean is being distorted by a single, non-recurring event is the first step toward financial maturity.
The Median: Finding the “True” Center
If the mean is prone to being skewed by outliers, the median is the stabilizing force. The median is the middle value in a dataset when the numbers are listed in ascending or descending order. If you have an even number of data points, the median is the average of the two middle numbers.
Why the Median Matters in Income and Wealth
Financial analysts often prefer the median to the mean when discussing income levels or home prices because it provides a more accurate picture of the “typical” experience. If you are comparing your salary to your peer group, the mean can be misleading because a few extremely high earners can pull the average upward, making it seem as if the average person earns more than they actually do. The median cuts through the noise.
Applying the Median to Your Budget
When analyzing your spending, the median is often more helpful than the mean. If you want to know what you “usually” spend on dining out, look at your monthly totals for the past year, sort them from lowest to highest, and pick the middle number. This number ignores the month you took a luxury vacation or the month you barely left the house. It tells you what your standard, consistent expenditure looks like, allowing for more realistic financial planning and goal setting.
The Mode: Identifying Frequency and Recurring Costs
The mode is the value that appears most frequently in a dataset. In statistics, it identifies the “most popular” occurrence. In your financial life, the mode is the secret weapon for identifying recurring patterns that might otherwise go unnoticed.

Tracking Recurring Transactions
You likely have many transactions that are identical or nearly identical in value. Your Netflix subscription, gym membership, or weekly gas station fill-up are all candidates for the mode. Identifying these recurring numbers helps you see the “rhythm” of your financial life.
Using the Mode for Strategic Savings
The mode is particularly effective when auditing your subscriptions or impulsive spending habits. If you find that the mode of your “miscellaneous” spending category is a specific dollar amount—for instance, $15 transactions at a specific coffee shop—it signals a behavioral pattern rather than a random event. While the mean gives you an idea of volume, the mode gives you an idea of habit. Recognizing these repeated values allows you to decide if that habit aligns with your long-term financial goals or if it is a leak in your budget that needs to be plugged.
The Range: Measuring Volatility and Risk
The range is the difference between the highest and lowest values in a dataset. Calculated by subtracting the minimum value from the maximum value, the range provides a quick assessment of volatility. In finance, volatility is essentially risk, and understanding your personal range is vital for long-term stability.
Assessing Portfolio Volatility
If you are an investor, the range of your portfolio’s monthly returns tells a story of risk. A narrow range suggests consistency—your returns are predictable and stable. A wide range indicates high volatility, meaning your portfolio fluctuates significantly between peaks and troughs. For those approaching retirement, understanding the range of their investment returns is essential for determining how much “cushion” they need in their liquid savings.
Managing Cash Flow Swings
The range is equally important when analyzing your personal cash flow, especially for freelancers or those with variable income. By calculating the range of your income over the past year, you can determine your “worst-case” and “best-case” scenarios. If your income ranges from $3,000 to $7,000 per month, your budget must be structured to accommodate the $3,000 low point. If you ignore the range and base your spending on the $7,000 high point, you risk falling into debt during leaner months. The range defines the boundaries of your financial safety net.
Synthesizing Data for Financial Mastery
To truly take control of your financial future, you must look at these four metrics as a cohesive set. No single number tells the whole story, but together, they create a comprehensive diagnostic tool.
Creating a Financial Dashboard
Start by creating a simple spreadsheet to track your key metrics. List your monthly income, essential expenses, and discretionary spending. Calculate the mean to understand your general averages, the median to find the center, the mode to identify habits, and the range to measure your risks.
When you see that your mean spending is $4,000 but your median is $3,500, you immediately know that a few high-expense months are pulling your average up. When you see a range of $2,000 between your lowest and highest spending months, you know you need to build a larger emergency fund to buffer against that volatility.
From Data to Decision-Making
Data is only valuable if it leads to action. Once you understand the statistics of your money, you can make informed decisions:
- If the mode shows frequent small impulse buys, automate a savings transfer to occur as soon as your paycheck hits to reduce the available cash for those impulse transactions.
- If the range of your income is too wide, prioritize building a “buffer” fund that equals the difference between your highest and lowest income months.
- If the mean of your investments is lower than the median, investigate why a few major losses are dragging down your overall performance.
By applying mean, median, mode, and range to your personal finances, you move away from the anxiety of not knowing where your money goes. You stop guessing and start calculating. You gain a level of predictability that allows you to invest more aggressively, save more effectively, and sleep better at night knowing that your financial decisions are backed by hard, clear, and actionable data. Financial literacy isn’t just about reading a bank statement; it is about interpreting the numbers to build the life you want.
aViewFromTheCave is a participant in the Amazon Services LLC Associates Program, an affiliate advertising program designed to provide a means for sites to earn advertising fees by advertising and linking to Amazon.com. Amazon, the Amazon logo, AmazonSupply, and the AmazonSupply logo are trademarks of Amazon.com, Inc. or its affiliates. As an Amazon Associate we earn affiliate commissions from qualifying purchases.