In the fast-paced world of business, finance, and technology, understanding performance metrics is paramount for informed decision-making. Among the myriad acronyms and data points, “YTD” stands out as a fundamental concept that provides crucial context and clarity. YTD, an abbreviation for “Year-to-Date,” is a measurement of a particular period of time that begins on the first day of the current calendar year or fiscal year and continues up to the present day. It’s a snapshot, a running tally, that allows individuals and organizations to assess progress, identify trends, and make strategic adjustments before the year concludes.
Far from being a mere accounting term, YTD permeates various sectors, offering invaluable insights into everything from investment returns and personal spending habits to brand reputation and software development cycles. This article will delve into the core meaning of YTD, exploring its significance and practical applications across the diverse domains of technology, branding, and personal and corporate finance – the very pillars of our modern economic landscape. By dissecting YTD’s role in each of these areas, we can unlock a deeper appreciation for its power as an analytical tool, transforming raw data into actionable intelligence that drives success and growth.
The Core Concept: Deconstructing Year-to-Date
At its heart, Year-to-Date is a straightforward yet incredibly powerful metric. It provides a consistent window of observation, allowing for comparative analysis and trend identification throughout a given year. Understanding its precise definition and the rationale behind its widespread use is the first step toward leveraging its full potential.
A Simple Definition and Calculation
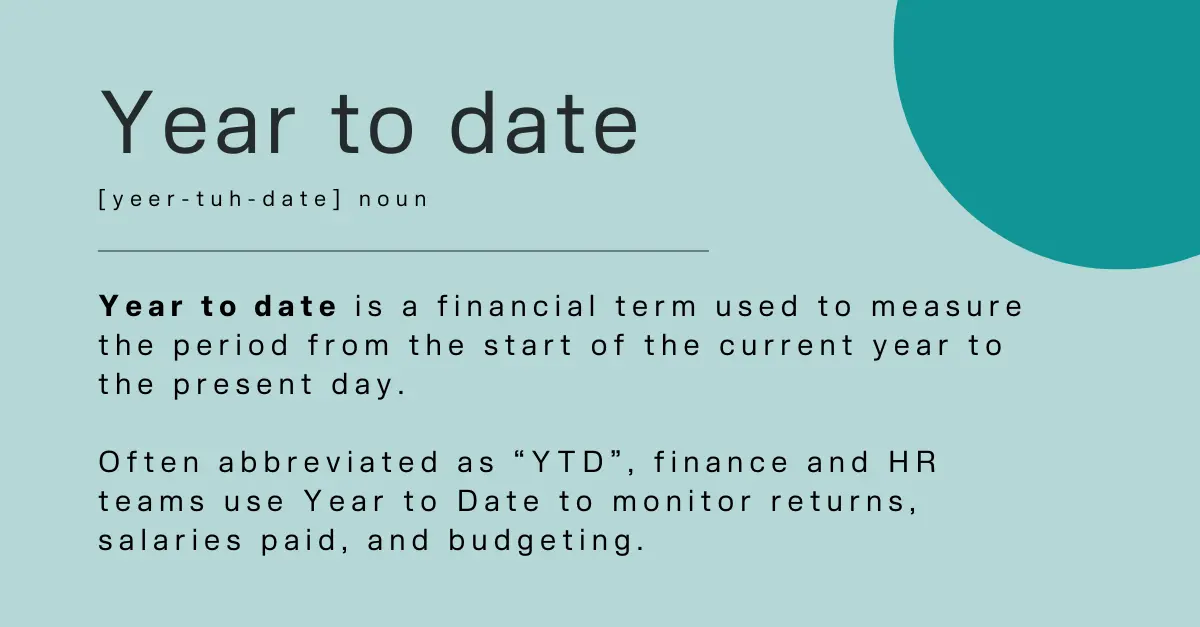
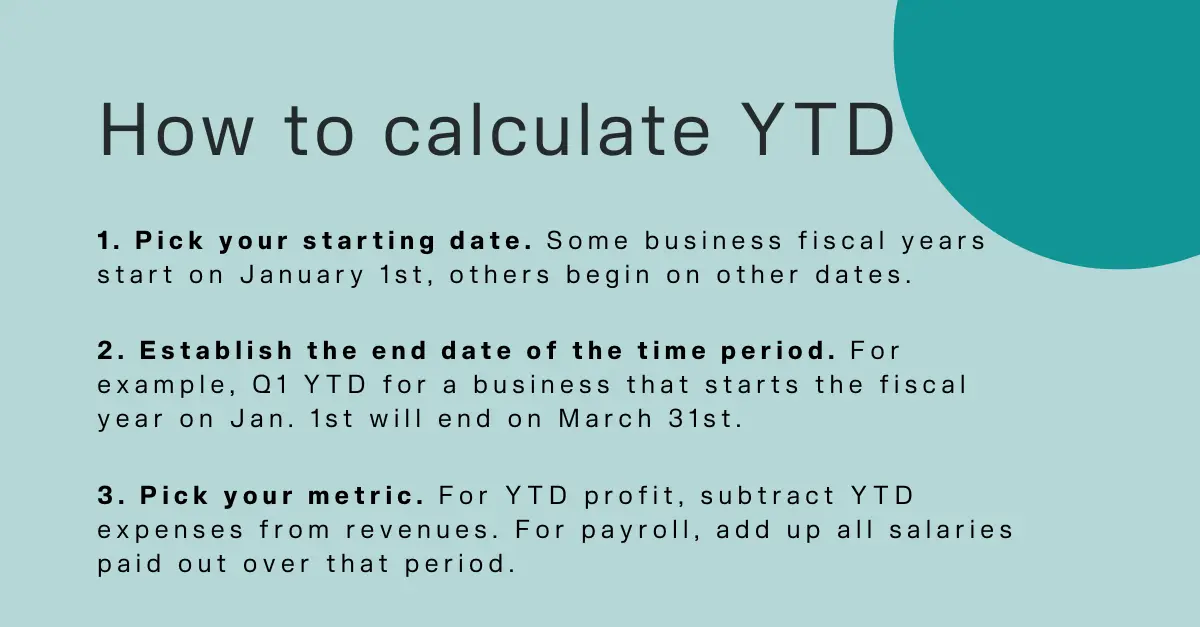
Fundamentally, YTD refers to the period starting from January 1st of the current calendar year (or the beginning of a company’s fiscal year) up to the present date. For instance, if today is October 26th, 2023, then “YTD” would encompass all data recorded between January 1st, 2023, and October 26th, 2023. This cumulative nature is key: as each day passes, the YTD period expands, continuously adding new data points to the running total.
The calculation itself is simple aggregation. If you’re tracking sales, YTD sales would be the sum of all sales from January 1st until today. If it’s expenses, it’s the sum of all expenses over the same period. This continuous accumulation is what makes YTD particularly useful for understanding ongoing performance rather than just isolated monthly or quarterly figures. It smooths out short-term fluctuations, offering a more stable view of progress towards annual goals. While a calendar year (January 1st to December 31st) is most common for individuals and many businesses, it’s crucial to remember that some organizations operate on a fiscal year that may start in a different month, such as July 1st or October 1st. In such cases, YTD would follow the company’s specific fiscal year start date.
Why YTD Matters: Beyond Just a Number
The significance of YTD extends far beyond its simple definition. It serves as a vital tool for contextualization, comparison, and strategic planning across various fronts. Without YTD data, performance reviews would be fragmented, relying solely on monthly or quarterly snapshots that might not accurately reflect long-term trajectories.
Firstly, YTD provides essential context. A single month of high sales might look impressive, but when viewed in the YTD context, it might simply be a recovery from several preceding low months, or part of a consistent upward trend. This cumulative view helps differentiate between anomalies and genuine patterns. Secondly, it enables crucial comparisons. The most common and insightful comparison is “YTD vs. Prior Year YTD.” By comparing current performance up to a specific date with performance up to the same date in the previous year, businesses and individuals can gauge real growth or decline, adjusting for seasonality and ensuring an apples-to-apples evaluation. This allows for accurate assessment of whether improvements are being made or if strategies need to be revised.
Moreover, YTD is instrumental in performance evaluation. It acts as a continuous barometer against annual targets and budgets. For a business aiming for a specific annual revenue, tracking YTD revenue allows them to see if they are on track, ahead of schedule, or falling behind. This early warning system is critical for making proactive decisions. Finally, YTD data is a powerful input for decision-making. Investors use YTD returns to assess portfolio health; marketing teams use YTD lead generation to refine campaigns; and project managers use YTD task completion to reallocate resources. By understanding the year’s story so far, stakeholders can make more informed, data-driven choices that steer them towards their ultimate objectives.
YTD in the Tech World: Measuring Progress and Innovation
Technology is a realm defined by rapid innovation, iterative development, and constant optimization. In this dynamic environment, YTD metrics provide the necessary structure to measure progress, identify bottlenecks, and validate the impact of new tools and strategies. From software deployment to digital security, YTD helps tech professionals stay on course.
Software Development and Project Management
In software development, YTD is a crucial metric for tracking progress and ensuring projects remain on schedule and within scope. For agile teams, YTD might represent the cumulative number of user stories completed, features deployed, or bugs resolved since the beginning of the year. This helps project managers assess team velocity over an extended period, allowing for more accurate forecasting of future sprints and resource allocation. For SaaS (Software as a Service) companies, YTD metrics are indispensable for monitoring the health and growth of their user base and revenue streams. Key YTD indicators include new subscribers acquired, churn rate (customers lost), and revenue growth. A strong YTD increase in subscribers coupled with a decreasing YTD churn rate signals a healthy, growing platform. Furthermore, in the age of AI, YTD performance of AI models—such as YTD accuracy improvements, YTD data processed, or YTD reduction in false positives—can be critical for evaluating the effectiveness and evolution of machine learning initiatives. These metrics help determine if AI tools are delivering the promised efficiency and insights, warranting continued investment and refinement.
Digital Security and Performance Analytics
Digital security is a relentless battle against ever-evolving threats. YTD metrics offer a sobering yet essential overview of an organization’s security posture and the effectiveness of its defensive measures. Security teams often track YTD cyberattacks detected and prevented, YTD successful breaches, and YTD time to resolution for security incidents. A declining trend in YTD successful breaches, coupled with a consistent YTD detection rate, would indicate an improving security infrastructure. Similarly, for system administrators and DevOps teams, YTD uptime percentages are a critical measure of system reliability and availability. A YTD uptime of 99.9% demonstrates a robust infrastructure that consistently supports business operations.
Beyond security, performance analytics for websites, applications, and digital services heavily rely on YTD data. Marketing and product teams track YTD user engagement metrics like unique visitors, page views, bounce rates, and conversion rates. A steady increase in YTD unique visitors or a decrease in YTD bounce rate indicates successful user acquisition and engagement strategies. For hardware and gadget manufacturers, YTD sales figures, customer satisfaction scores (e.g., YTD Net Promoter Score), and warranty claims provide vital feedback on product market fit and quality control, guiding future product development and marketing efforts.
Technology Investment and Trend Analysis
The technology sector is a magnet for investment, and YTD performance is a standard metric for evaluating the financial health and growth trajectory of tech companies. Investors frequently look at YTD stock returns for individual tech giants or entire tech sector ETFs to gauge market sentiment and investment profitability. A company showing strong YTD revenue growth and YTD profit margins is often seen as a more attractive investment. On a broader scale, YTD is instrumental in analyzing technology trends and market adoption. Researchers and industry analysts track YTD growth in the usage of specific technologies, such as YTD adoption rates for cloud computing services, YTD sales of AI-powered devices, or YTD downloads of emerging app categories. These YTD trends help businesses understand the direction of the market, identify nascent opportunities, or anticipate shifts that could disrupt existing models. Internally, large tech organizations use YTD budget tracking for their research and development (R&D) departments, infrastructure spending, and capital expenditures, ensuring that investments align with strategic goals and remain within financial constraints.
YTD in Branding and Marketing: Shaping Perceptions and Growth
For brands, YTD metrics provide a comprehensive lens through which to evaluate their presence, perception, and persuasive power in the marketplace. Marketing and branding are long-term games, but YTD offers crucial mid-year checkpoints to ensure efforts are yielding desired results and contributing to sustainable growth.
Measuring Brand Performance and Reputation
A strong brand is built on consistent messaging and positive public perception. YTD metrics are invaluable for tracking these intangible assets. Brands diligently monitor YTD brand mentions across various media, categorizing them by sentiment (positive, negative, neutral) to understand their year-to-date reputation. A rise in YTD positive mentions and media coverage indicates successful PR and brand-building activities. Website traffic and lead generation are direct indicators of a brand’s digital presence. YTD unique visitors, page views, and conversion rates reveal how effectively a brand is attracting and engaging its target audience throughout the year. For instance, a significantly higher YTD conversion rate compared to the previous year YTD suggests improvements in website design, user experience, or marketing messaging. Brand awareness campaigns, often run for extended periods, can be assessed by YTD reach, impressions, and engagement rates on social media platforms. Finally, customer satisfaction, a cornerstone of brand loyalty, is often measured through YTD Net Promoter Scores (NPS) or YTD aggregate review ratings, providing a year-long pulse on how well a brand is meeting customer expectations and fostering advocacy.
Marketing Campaign Effectiveness and ROI

Marketing efforts demand accountability, and YTD data provides a clear picture of return on investment (ROI) over an extended period. Marketing teams meticulously track YTD ad spend against YTD revenue generated, allowing them to calculate the cost-effectiveness of their campaigns. This helps in understanding which channels and strategies are delivering the best financial outcomes year-to-date. Campaign reach and impressions are also vital YTD metrics, encompassing YTD social media follower growth, YTD email list expansion, and the cumulative views of digital ads. These figures highlight the expanding audience base and the brand’s ability to penetrate the market. Conversion rates, whether it’s YTD lead-to-customer conversion or YTD sign-ups for a particular service, are crucial for assessing the efficiency of the sales funnel. By comparing these YTD rates against previous years or industry benchmarks, marketers can identify areas for optimization. Public Relations (PR) efforts, which aim to secure earned media, also benefit from YTD tracking. YTD media placements, YTD articles published about the brand, and YTD calculated earned media value help demonstrate the cumulative impact of PR activities, often correlating with increased brand visibility and credibility.
Personal Branding and Influence Tracking
In today’s interconnected world, personal branding has become as critical as corporate identity, especially for thought leaders, entrepreneurs, and professionals. YTD metrics offer a quantifiable way to track the growth and impact of a personal brand. Individuals can monitor their YTD growth in professional networks, such as LinkedIn connections or social media followers, indicating an expanding reach and influence. Content performance is another key area: YTD article views on platforms like Medium or LinkedIn, YTD podcast listens, or YTD video views on YouTube demonstrate the cumulative engagement with one’s intellectual output. This data helps individuals understand which content resonates most with their audience over the course of the year. For those who leverage their personal brand for professional opportunities, YTD tracking of speaking engagements, publications, or collaborative projects showcases increasing authority and demand. Crucially, revenue generated from personal brand activities—such as YTD consulting fees, YTD book sales, or YTD affiliate income—provides a tangible measure of the brand’s financial viability and growth as a business asset. By consistently monitoring these YTD metrics, individuals can strategically refine their personal branding efforts to achieve their career and financial objectives.
YTD in Money and Finance: Guiding Investment and Personal Wealth
Money and finance are perhaps the most immediate and intuitive applications of YTD. From managing personal budgets to analyzing complex investment portfolios, YTD provides a critical framework for understanding financial performance and making judicious decisions throughout the year.
Personal Finance and Budgeting
For individuals, YTD is an indispensable tool for managing personal finances and adhering to a budget. Tracking YTD gross income and YTD net income provides a clear picture of earnings accumulation, helping individuals assess their financial standing relative to annual income goals. Equally important is YTD expense tracking, where spending is categorized to show cumulative outflows on housing, food, transportation, and discretionary items. This cumulative view allows for mid-year adjustments if spending in certain categories is exceeding the budgeted YTD amount, preventing financial strain later in the year.
Savings goals are often annual, making YTD contributions to savings accounts, investment portfolios, or retirement funds a vital metric. By comparing YTD contributions against annual targets, individuals can determine if they are on pace to achieve their financial milestones. Similarly, for those managing debt, YTD principal paid off on loans or credit card balances shows tangible progress towards becoming debt-free. Utilizing financial tools and apps that automatically calculate YTD figures empowers individuals to stay on top of their financial health, enabling proactive adjustments to spending, saving, and investing behaviors.
Investing and Portfolio Performance
In the world of investing, YTD is arguably one of the most frequently cited metrics. It offers a concise way to understand the performance of an investment over the current year. Investors closely monitor YTD percentage gain or loss for individual stocks, mutual funds, exchange-traded funds (ETFs), and other assets. This metric allows for direct comparison of different investments’ performance within the same timeframe, helping to evaluate which assets are contributing positively or negatively to the portfolio’s overall health during the current year.
Beyond individual assets, YTD total return of an entire investment portfolio is a critical indicator of wealth growth. It summarizes the combined performance of all holdings, providing a holistic view of how an investor’s capital is appreciating or depreciating. Dividend income, often a significant component of investment returns, is also tracked YTD, showing the cumulative passive income generated from holdings. For real estate investors, YTD rental income, YTD property value appreciation, and YTD expenses provide a clear financial snapshot of their real estate ventures, guiding decisions on property management, acquisitions, and divestitures. YTD performance is also frequently benchmarked against market indices (e.g., S&P 500 YTD return) to determine if an investment strategy is outperforming or underperforming the broader market.
Business Finance and Operational Insights
For businesses, especially those leveraging online income streams or side hustles, YTD financial reporting is fundamental for operational insights and strategic planning. YTD total revenue and YTD sales by product or service category are essential for understanding the company’s income trajectory. These figures directly feed into profitability analysis, with YTD gross profit and YTD net profit providing a year-long perspective on the business’s financial health after accounting for costs and expenses.
Cash flow, the lifeblood of any business, is closely monitored through YTD cash inflows and outflows, ensuring liquidity and solvency throughout the year. This helps identify periods of high cash burn or strong cash generation, allowing for better working capital management. Many businesses also conduct YTD budget vs. actuals variance analysis, comparing planned financial performance against real-world results up to the current date. Significant YTD variances can trigger investigations and adjustments to operations or future budgeting. Even for individuals running side hustles, tracking YTD income generated and YTD expenses provides a crucial understanding of their venture’s profitability and potential for scaling. Comprehensive financial tools and accounting software are vital for automating these YTD calculations, providing real-time data that empowers businesses of all sizes to make agile and informed financial decisions.
Best Practices for Utilizing YTD Data
While YTD is a powerful metric, its true value is unlocked when interpreted thoughtfully and leveraged effectively. Simply knowing the YTD number isn’t enough; it’s about understanding what that number signifies and how it informs future actions.
Context is King
Never look at a YTD figure in isolation. The number itself provides little insight without context. Always compare current YTD performance with previous periods, most commonly “YTD vs. Prior Year YTD.” This comparison helps normalize for seasonality and reveals genuine growth or decline trends. For example, if your YTD sales are up 10%, but last year YTD sales were up 20%, your current performance, while positive, has actually slowed down relative to the previous year. Additionally, always benchmark YTD figures against your annual goals and budgets. Are you on track to meet your targets? If not, by how much are you off, and what adjustments are needed? Furthermore, consider external factors that might influence YTD performance, such as market conditions, economic downturns, industry-specific trends, or even global events. A dip in YTD sales might be alarming, but less so if the entire industry has experienced a similar or worse decline due to unforeseen circumstances.
Leverage Technology for Insight
In today’s data-rich environment, manual YTD calculations are inefficient and prone to error. Modern technology offers robust solutions for collecting, analyzing, and visualizing YTD data. Financial software platforms (e.g., QuickBooks, Xero), personal finance apps (e.g., Mint, YNAB), and sophisticated analytics platforms (e.g., Google Analytics, CRM dashboards) automatically calculate and display YTD metrics, often in real-time. Business Intelligence (BI) tools (e.g., Tableau, Power BI) can integrate data from various sources to create comprehensive YTD reports and dashboards, allowing for quick insights and drill-down analysis. Leveraging these tools not only automates the calculation but also facilitates the identification of trends, anomalies, and correlations that might otherwise be missed. The ability to visualize YTD performance through charts and graphs makes complex data more accessible and digestible, aiding in quicker and more effective interpretation.
Actionable Insights
The ultimate purpose of YTD data is to drive actionable insights and inform decision-making. Don’t just report the numbers; use them to ask critical questions and formulate strategies. If YTD revenue is lagging behind target, what specific marketing or sales tactics can be implemented to accelerate growth in the remaining months? If YTD expenses are over budget in a particular category, where can cuts be made, or efficiencies gained? If YTD customer churn is higher than desired, what product improvements or customer service initiatives can be launched to retain more users? YTD performance should be a constant feedback loop, prompting continuous adjustments and optimizations. It empowers individuals and organizations to pivot quickly, capitalize on opportunities, and mitigate risks before they escalate, ensuring that the year concludes not just with an understanding of what happened, but with a clear trajectory for future success.
Conclusion
The question “what is YTD mean” unlocks a fundamental concept that underpins effective measurement and strategic planning across virtually every domain. Year-to-Date is far more than a simple calculation; it’s a dynamic lens that provides a running tally of performance from the beginning of the year to the present day. This cumulative perspective is indispensable for anyone seeking to understand progress, identify trends, and make informed decisions.
As we’ve explored, YTD serves as a critical compass in the tech world, guiding software development, securing digital assets, and informing investment in innovation. In the realm of branding, it’s a powerful barometer for measuring reputation, evaluating marketing campaigns, and tracking the growth of personal influence. And in the world of money, YTD is the bedrock for meticulous personal budgeting, savvy investment management, and insightful business financial analysis.
By embracing YTD best practices—always contextualizing data, leveraging technological tools, and translating insights into actionable strategies—individuals and organizations can transform raw numbers into a powerful narrative of their journey through the year. YTD empowers us to not only look back at where we’ve been but, more importantly, to look forward with clarity, ensuring that every decision made contributes meaningfully to achieving our overarching goals. It is, in essence, a continuous pulse check, vital for navigating the complexities of modern life and business with confidence and precision.
aViewFromTheCave is a participant in the Amazon Services LLC Associates Program, an affiliate advertising program designed to provide a means for sites to earn advertising fees by advertising and linking to Amazon.com. Amazon, the Amazon logo, AmazonSupply, and the AmazonSupply logo are trademarks of Amazon.com, Inc. or its affiliates. As an Amazon Associate we earn affiliate commissions from qualifying purchases.