In the world of professional finance and wealth management, timing is often cited as the differentiator between a modest return and exponential growth. While many novice investors focus solely on price—the “how much”—seasoned professionals focus on the “when.” This temporal dimension of the market is best understood through the lens of the “wave period.”
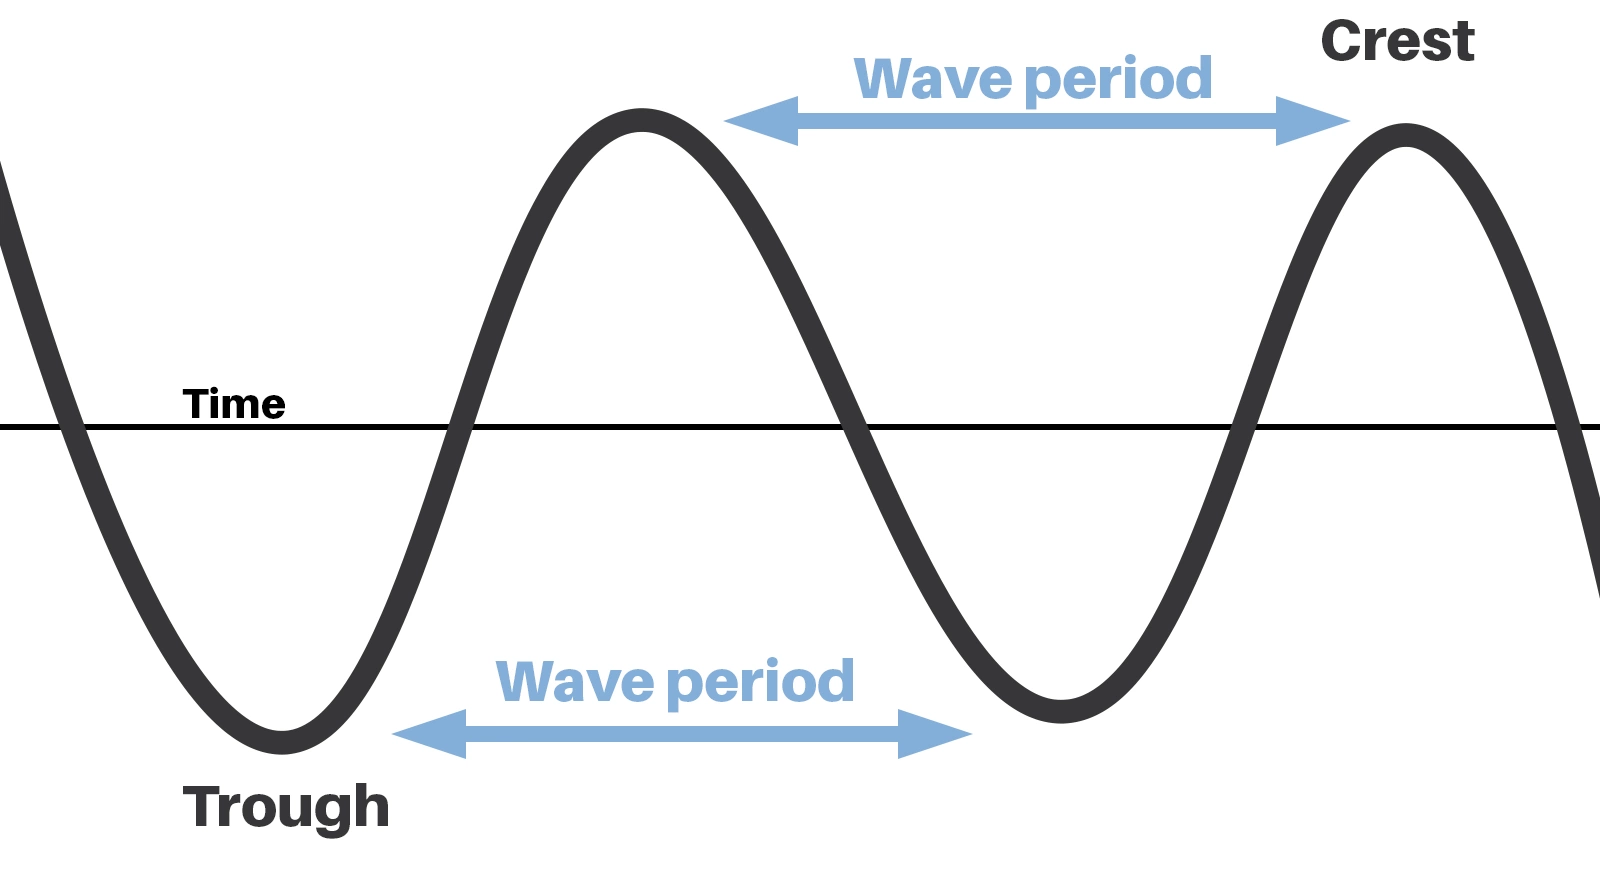
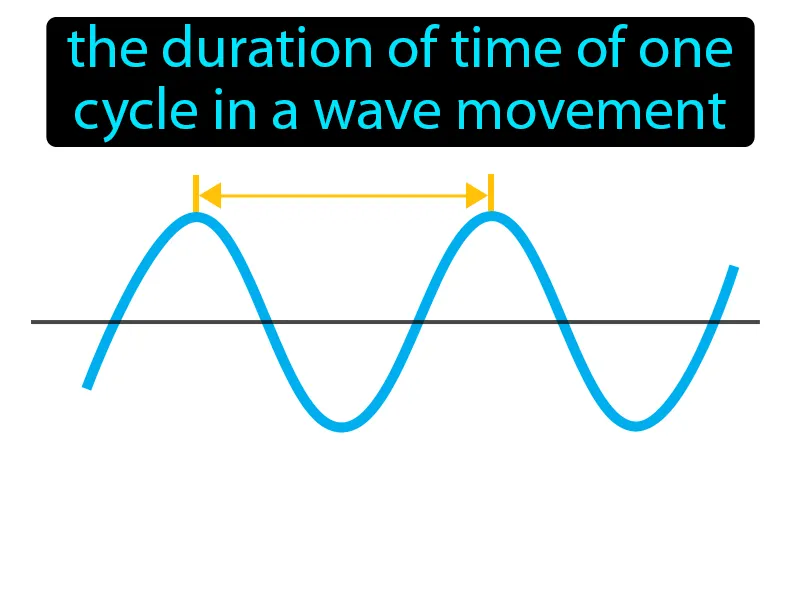
In a financial context, a wave period refers to the duration of time it takes for a market cycle, price pattern, or economic trend to complete one full oscillation from peak to peak or trough to trough. Just as oceanographers measure the time between physical waves to predict the power of the sea, financial analysts use wave periods to predict market volatility, identify entry points, and manage risk. Understanding the wave period is essential for anyone looking to master market cycles and build a resilient investment portfolio.
The Core Concept: Defining the “Wave Period” in Financial Markets
To understand wave periods in money and investing, we must first translate a physical concept into a fiscal one. In physics, the period is the time required for one complete cycle of a vibration to pass a given point. In finance, this translates to the rhythmic expansion and contraction of liquidity and asset prices.
From Physics to Finance: The Mathematical Foundation
Every asset class—whether it be equities, commodities, or cryptocurrencies—moves in waves. These are not random fluctuations but are driven by human psychology and mechanical trading systems. The “period” is the horizontal axis of a chart: time. When we ask, “What is the wave period of this bull market?” we are essentially asking how long the current momentum is expected to last before a mean reversion occurs. By calculating the average duration of past cycles, investors can create a probabilistic framework for future performance.
The Anatomy of a Market Wave
A financial wave consists of two primary phases: the impulse (the move in the direction of the primary trend) and the corrective phase (the retracement). The wave period encompasses both. For example, in a three-year wave period, we might see 24 months of steady growth followed by 12 months of consolidation or decline. Recognizing where an asset sits within its current period allows an investor to determine if they are buying at the “crest” (the peak) or the “trough” (the bottom).
Elliott Wave Theory: The Standard for Measuring Market Periods
No discussion of wave periods in finance is complete without addressing Elliott Wave Theory. Developed by Ralph Nelson Elliott in the 1930s, this theory posits that stock markets do not behave in a chaotic manner but rather move in repetitive, cyclical patterns.
The Five-Wave Impulse Pattern
Elliott identified that the dominant trend always moves in a five-wave pattern. Waves 1, 3, and 5 are upward “motive” waves, while waves 2 and 4 are smaller corrective dips. The “period” here is critical; the duration of Wave 3 is often the longest, representing the strongest part of a bull market. Investors who can identify the start of this specific wave period can capitalize on the most aggressive period of wealth accumulation.
Corrective Waves and Time Intervals
Following the five-wave impulse is a three-wave corrective period, often labeled A-B-C. The wave period of the correction is frequently proportional to the impulse that preceded it. This is where the concept of “time-price symmetry” comes into play. If a market took six months to rally (the impulse period), a professional analyst might expect a three-month period of cooling off. Understanding these intervals prevents the common mistake of “buying the dip” too early before the wave period has actually concluded its downward trajectory.
How Wave Periods Impact Modern Trading Strategies
Understanding the duration of market cycles has a direct impact on the tools and strategies a trader employs. Depending on the length of the wave period, an investor must adjust their perspective from micro-fluctuations to macro-trends.
Swing Trading vs. Long-Term Positioning
For a swing trader, the wave period might be measured in days or weeks. They look for “secondary waves” within a larger trend to capture quick profits. Conversely, for a value investor or a retirement planner, the wave period is measured in years or even decades. The strategy changes based on the “frequency” of the wave. High-frequency waves require automated AI tools and tight stop-losses, while low-frequency, long-period waves require fundamental analysis and patience.
Using Volatility Indicators to Gauge Periodicity
Modern financial tools like the Moving Average Convergence Divergence (MACD) and the Relative Strength Index (RSI) are essentially “wave gauges.” They measure the velocity and the period of price movements. When the RSI remains in overbought territory for an extended period, it indicates that the current wave period is reaching an unsustainable peak. By watching how these indicators oscillate over specific timeframes, investors can identify the “wavelength” of a particular stock’s volatility, allowing them to time their exits with professional precision.
Identifying Economic Super-Cycles: The Long-Term Wave Period
Beyond individual stocks, the entire global economy moves in massive wave periods known as “Super-Cycles.” These are driven by generational shifts, technological revolutions, and debt cycles.
The Kondratieff Wave and Generational Wealth
One of the most famous long-term wave periods is the Kondratieff Wave (or K-Wave), which suggests that capitalist economies experience cycles of growth and decline lasting approximately 50 to 60 years. These periods are triggered by major technological breakthroughs—such as the steam engine, the internet, or now, Artificial Intelligence. Identifying which “season” of the K-Wave we are in (Spring, Summer, Autumn, or Winter) is vital for long-term asset allocation. For instance, the “Autumn” of a cycle is often characterized by a final speculative bubble, which is the most dangerous time for unseasoned investors to enter the market.
The Role of Interest Rates in Defining Financial Cycles
Central banks, such as the Federal Reserve, essentially manage the wave period of the economy by adjusting interest rates. Lower rates shorten the period between growth cycles by injecting liquidity, while higher rates lengthen the period by slowing down economic activity. For a savvy investor, monitoring the “interest rate wave” is perhaps the most important macro-signal. When the wave period of cheap credit ends, the wave period of asset de-leveraging begins.
Strategic Execution: Leveraging Wave Periods for Financial Success
Successful investing is not about predicting the future with 100% certainty; it is about understanding the rhythmic nature of capital. By identifying the wave period, you are essentially learning the heartbeat of the market.
Risk Management During Wave Transitions
The most significant losses in the financial world occur during “wave transitions”—the moment a period of growth ends and a period of contraction begins. Because most investors assume the current trend will continue indefinitely, they are caught off guard when the period resets. A professional approach involves tightening risk parameters as the expected wave period reaches its historical average duration. If a typical market cycle lasts eight years and we are in year seven, the “Money” move is to increase cash positions and hedge against the inevitable trough.

Practical Tools for Tracking Market Rhythms
To effectively track wave periods, investors should utilize:
- Cyclical Charts: Look at 10-year and 20-year views of an asset to see its natural rhythm.
- Fibonacci Time Zones: These are technical analysis tools that project future points of change based on the duration of previous waves.
- Sentiment Analysis: Market waves are driven by fear and greed. When sentiment reaches an extreme “period” of euphoria, the wave is likely about to break.
In conclusion, the “wave period” is the fundamental rhythm of the financial universe. Whether you are a day trader looking at five-minute intervals or a pension fund manager looking at thirty-year horizons, the principles remain the same. Markets move in cycles, cycles take time, and time is the most valuable variable in the equation of wealth. By shifting your focus from “what is the price” to “where are we in the wave period,” you transition from a reactive participant to a proactive architect of your financial future.
aViewFromTheCave is a participant in the Amazon Services LLC Associates Program, an affiliate advertising program designed to provide a means for sites to earn advertising fees by advertising and linking to Amazon.com. Amazon, the Amazon logo, AmazonSupply, and the AmazonSupply logo are trademarks of Amazon.com, Inc. or its affiliates. As an Amazon Associate we earn affiliate commissions from qualifying purchases.