
What is Today’s Dow Jones?
In the dynamic world of finance, few metrics command as much attention and influence as the Dow Jones Industrial Average (DJIA). Often simply referred to as “the Dow,” this iconic stock market index serves as a daily barometer for the health of corporate America and, by extension, the broader U.S. economy. For investors, financial professionals, and even the general public, knowing “what is today’s Dow Jones” isn’t just about a number; it’s about understanding the pulse of global markets and deciphering signals that could impact personal finances and strategic business decisions. This article delves into the significance of the Dow, how to interpret its daily movements, and its crucial role within a comprehensive financial strategy.

Understanding the Dow Jones Industrial Average (DJIA)
The Dow Jones Industrial Average is one of the oldest and most widely recognized stock market indices in the world. Established in 1896 by Charles Dow and Edward Jones, it was originally designed to measure the performance of the leading industrial companies in the United States. Over a century later, while its composition has evolved significantly beyond strictly “industrial” firms, its purpose remains much the same: to provide a clear, concise snapshot of the market’s direction.
A Legacy of Industrial Might: From Origins to Modern Composition
The very name “Industrial Average” harks back to an era dominated by heavy manufacturing. The initial index comprised just 12 stocks, including giants like General Electric and American Cotton Oil Company. As the U.S. economy transformed, so too did the Dow. Today, it tracks 30 large, publicly owned companies listed on the NASDAQ and the New York Stock Exchange. These are not just any companies; they are “blue-chip” corporations—established, financially sound, and leading in their respective sectors. This elite group includes household names from technology (e.g., Apple, Microsoft), finance (e.g., JPMorgan Chase, Goldman Sachs), healthcare (e.g., UnitedHealth Group, Johnson & Johnson), and consumer goods (e.g., Coca-Cola, Walmart). The selection process for these 30 companies is not governed by a rigid quantitative rule but rather by a committee from S&P Dow Jones Indices, which aims to select companies that represent a significant portion of the U.S. equity market and are considered to have excellent reputations, sustained growth, and interest to a large number of investors. This ensures the Dow remains a relevant and powerful indicator of the prevailing market sentiment and economic trends.
Price-Weighted vs. Market-Cap Weighted: Deciphering the Calculation
A critical aspect of understanding the Dow is its unique calculation method: it is a price-weighted average. This means that stocks with higher share prices have a greater impact on the index’s value than stocks with lower share prices, regardless of their total market capitalization (the total value of all outstanding shares). For instance, if Company A has a stock price of $300 and Company B has a stock price of $100, a $1 increase in Company A’s stock price will move the Dow more than a $1 increase in Company B’s stock price, even if Company B is a much larger company by market value. This contrasts sharply with market-capitalization-weighted indices like the S&P 500, where larger companies (by market cap) exert a proportionally greater influence.
To account for stock splits, spin-offs, and other structural changes that would otherwise distort the average, the Dow employs a “Dow Divisor.” This divisor is adjusted whenever a stock split or a change in the index’s composition occurs, ensuring that the index’s value remains comparable from one day to the next, reflecting true market movements rather than artificial price changes. While its price-weighted methodology is sometimes criticized for not fully reflecting the true scale of companies, it offers a simple, intuitive measure that has stood the test of time, providing a clear daily pulse.
The “Blue-Chip” Barometer: Why It’s a Bellwether for the U.S. Economy
The Dow’s enduring appeal as a “blue-chip barometer” stems from the stature of its constituent companies. These are not speculative ventures but established leaders whose collective performance often mirrors the broader economic landscape. When these 30 giants are thriving—reporting strong earnings, expanding operations, and demonstrating robust investor confidence—it generally signals a healthy economic environment. Conversely, widespread weakness among Dow components can indicate underlying economic headwinds or increased market apprehension. Because these companies operate across diverse sectors and often have global footprints, their combined performance provides insights into various facets of the economy, from consumer spending and industrial production to technological advancement and international trade. Thus, watching “today’s Dow Jones” isn’t merely about tracking stock prices; it’s about observing the collective sentiment and fundamental strength of America’s corporate titans, offering a valuable, albeit not exhaustive, bellwether for the U.S. economy.
Interpreting Daily Dow Movements
While the Dow’s historical significance is undeniable, its real-time value lies in its daily fluctuations. Understanding what drives these movements and how to interpret them is crucial for anyone seeking to make informed financial decisions or simply gauge the market’s temperament.
Beyond the Numbers: What Drives the Swings?
The daily movements of the Dow are a complex interplay of numerous factors, both micro and macro. At the forefront are corporate earnings reports. When one or more of the 30 Dow components announce earnings that beat or miss expectations, their stock prices react sharply, influencing the index. Beyond individual company news, economic data releases play a pivotal role. Reports on GDP growth, inflation (CPI, PPI), unemployment rates, manufacturing output, and consumer confidence can significantly sway market sentiment. Positive data often boosts confidence, while negative data can trigger sell-offs.
Geopolitical events are another powerful catalyst. International conflicts, trade disputes, shifts in government policy, or major political developments can introduce uncertainty, leading investors to re-evaluate risk and adjust their portfolios, impacting the Dow. Furthermore, central bank actions, particularly those by the Federal Reserve, are closely watched. Decisions on interest rates, quantitative easing, or other monetary policy adjustments can have profound effects on borrowing costs, corporate profitability, and investor appetite for risk. Finally, sheer market sentiment and investor psychology can create momentum, with trends accelerating based on fear or greed, sometimes decoupled from immediate fundamental news.
Percentage Change vs. Point Change: The Importance of Relative Movement
When the Dow moves, it’s often reported in points—e.g., “The Dow closed up 200 points.” While this number provides an absolute measure, it’s crucial to consider the percentage change for a true understanding of the movement’s significance. A 200-point gain when the Dow is at 10,000 points (a 2% increase) is far more substantial than a 200-point gain when the Dow is at 30,000 points (a 0.67% increase). As the index’s value has grown over the decades, larger point swings have become more common, often representing smaller percentage changes than similar point moves in the past. Focusing on the percentage change provides a standardized measure of volatility and helps in comparing daily movements across different periods, offering a more accurate gauge of market activity and momentum.
Volatility and What It Means: Understanding Normal Fluctuations and Significant Shifts
Market volatility refers to the degree of variation of a trading price over time. A “volatile” market experiences sharp upswings and downturns. For the Dow, periods of high volatility can be unsettling, but it’s important to distinguish between normal market fluctuations and genuinely significant shifts. Daily movements of 0.5% to 1% are common and generally considered part of normal market noise, driven by the continuous flow of news and trading activity. However, percentage changes exceeding 2% or 3% in a single day often signal a more significant event or a pronounced shift in investor sentiment, warranting closer attention.
Understanding volatility also involves context. Is the market reacting to a clear, fundamental change in economic outlook, or is it a speculative frenzy? Tools like the VIX (Volatility Index), often called the “fear gauge,” can provide insight into expected market volatility, though the Dow itself offers a direct measure of realized volatility for its 30 constituents. While high volatility can present opportunities for nimble traders, for long-term investors, it often underscores the importance of a diversified portfolio and a disciplined approach, helping to ride out short-term turbulence.
The Dow’s Role in a Broader Investment Strategy
For all its prominence, the Dow Jones Industrial Average is but one piece of the vast and intricate puzzle of financial markets. Its role in a well-rounded investment strategy is as an indicator and a reference point, not as a sole guide for decision-making.
Not Just One Index: Diversification Beyond the Dow
Relying solely on the Dow as a measure of market health or as an investment vehicle would be a significant oversight. While powerful, it only represents 30 large-cap U.S. companies. A truly diversified investment strategy must look beyond this singular index. The S&P 500, for instance, tracks 500 of the largest U.S. companies by market capitalization, offering a broader and more representative view of the U.S. large-cap equity market. The Nasdaq Composite is heavily weighted towards technology and growth stocks, reflecting innovation and future trends. The Russell 2000 focuses on small-cap companies, providing insight into a different segment of the economy with unique growth potential and risk profiles.
Furthermore, a global perspective is essential. International indices (e.g., FTSE 100, Nikkei 225, DAX) and emerging markets offer diversification benefits and exposure to different economic cycles. Beyond equities, a comprehensive strategy should consider fixed-income assets (bonds), real estate, and potentially alternative investments to manage risk and enhance returns across various market conditions. Understanding “today’s Dow Jones” is valuable, but it’s imperative to view it within the context of these other indices and asset classes for a complete market picture.
Short-Term Noise vs. Long-Term Trends: Avoiding Panic and Focusing on Strategic Goals
One of the greatest challenges for investors is distinguishing between short-term market noise and enduring long-term trends. Daily Dow fluctuations, driven by transient news cycles or emotional trading, are often just noise. Reacting impulsively to every dip or surge can lead to poor decision-making, such as selling during a downturn and missing the subsequent recovery, or chasing high-flying stocks that are due for a correction.
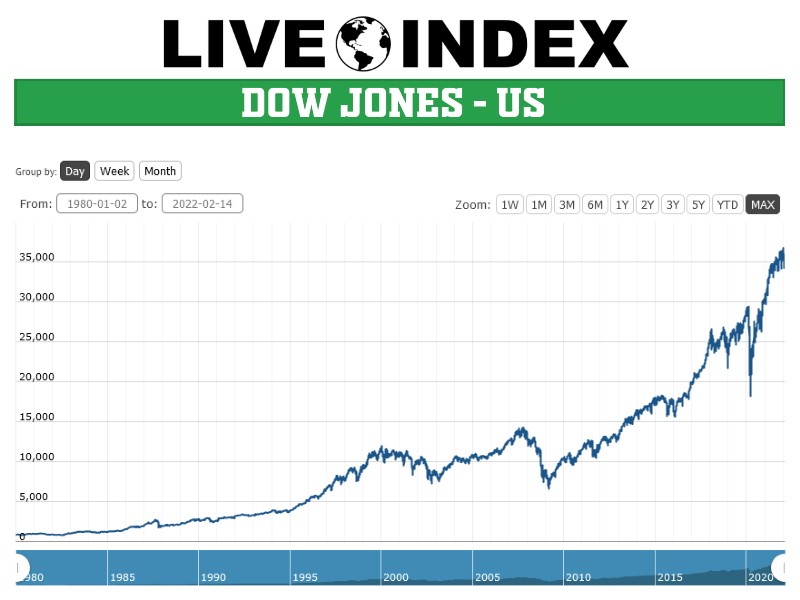
A core principle of successful investing is to focus on long-term strategic goals. This means having a clear understanding of your financial objectives (retirement, home purchase, education), your risk tolerance, and your investment horizon. Historically, major indices like the Dow have shown a consistent upward trend over extended periods, despite numerous corrections and bear markets. By maintaining a disciplined approach, sticking to your asset allocation, and regularly rebalancing your portfolio, investors can leverage the long-term growth potential of the market while minimizing the impact of short-term volatility. The Dow’s journey over decades underscores the power of compounding and patience.
Using the Dow as an Indicator, Not a Sole Guide: Its Limitations and Strengths
The Dow’s primary strength lies in its simplicity and historical resonance. It serves as a readily accessible proxy for the sentiment surrounding major U.S. corporations. When discussing market performance in casual conversation or news headlines, the Dow is often the go-to reference. However, its limitations are also significant. Its price-weighted nature means a high-priced stock with a smaller market cap can have more influence than a low-priced stock of a massive company. Its narrow focus on just 30 companies means it doesn’t represent the entire breadth of the U.S. economy, particularly small-cap firms or specific sectors that aren’t included.
Therefore, the Dow should be used as one of several indicators. It can signal general market direction, provide insight into the performance of established industry leaders, and act as a psychological benchmark. But for detailed analysis, portfolio construction, or understanding specific sector performance, other, more specialized indices and comprehensive financial data are indispensable. An informed investor considers “today’s Dow Jones” as a headline, then delves deeper into broader market statistics, economic fundamentals, and individual company performance before making any significant investment decisions.
Accessing and Analyzing Dow Jones Data
In the digital age, accessing real-time financial information has never been easier. For anyone looking to track “today’s Dow Jones,” a wealth of resources is available, providing both raw data and insightful analysis.
Real-Time vs. Delayed Data: Where to Find Current Information
The immediacy of financial markets means that real-time data is highly valued. Most major financial news websites (e.g., Bloomberg, Reuters, Wall Street Journal, CNBC, Yahoo Finance) offer streaming real-time or near real-time quotes for the Dow. Brokerage platforms also provide their clients with up-to-the-second data for the Dow and its components, often integrated with trading tools and analytical charts. For those who don’t require absolute real-time precision, many free online sources offer data with a 15-20 minute delay, which is generally sufficient for most retail investors tracking daily trends. It’s crucial to be aware of the data delay to avoid making decisions based on outdated information, especially during periods of high volatility.
Key Metrics to Track: Open, Close, High, Low, Volume, Year-to-Date Performance
When reviewing Dow data, several key metrics provide a comprehensive picture of its daily performance:
- Open: The index’s value at the start of the trading day.
- Close: The index’s value at the end of the trading day, often the most quoted figure.
- High: The highest value the index reached during the trading day.
- Low: The lowest value the index touched during the trading day.
- Volume: For ETFs or futures contracts tracking the Dow, this indicates the number of shares or contracts traded, signaling market interest and liquidity.
- Year-to-Date (YTD) Performance: Shows the percentage change in the index’s value since the beginning of the calendar year, providing context for current movements within a broader timeframe.
These metrics, combined with charts illustrating historical trends, help investors contextualize daily fluctuations and identify emerging patterns.
Analytical Tools and Resources: Charting, News Feeds, Expert Commentary
Beyond raw numbers, a plethora of analytical tools and resources can help in deciphering the Dow’s movements. Charting software, available on most financial platforms, allows users to visualize price trends over various timeframes, apply technical indicators (like moving averages or Bollinger Bands), and identify support and resistance levels. News feeds from reputable financial outlets provide the latest headlines and analysis, explaining the catalysts behind market moves. Expert commentary from economists, market strategists, and investment professionals can offer valuable perspectives, interpreting complex market events and economic data. While no single tool guarantees foresight, combining these resources enables a more informed and nuanced understanding of “today’s Dow Jones” and its potential implications for the financial landscape.
The Future of the Dow and Your Investments
The Dow Jones Industrial Average has proven its resilience and adaptability over more than a century. As economies evolve, so too will this venerable index, continuously reflecting the changing face of corporate America and influencing individual investment strategies.
Evolving Composition: Reflecting Economic Shifts
The enduring relevance of the Dow lies in its capacity to evolve. The selection committee regularly reviews its constituents, replacing companies that no longer meet the “blue-chip” criteria or those whose industries have become less representative of the broader economy. This dynamic composition ensures that the Dow remains a snapshot of leading U.S. economic forces. For example, industrial giants of the past have given way to technology and healthcare behemoths, reflecting fundamental shifts in economic drivers. This ongoing evolution means that “today’s Dow Jones” is always a contemporary reflection of market leadership, offering a forward-looking perspective, even as its methodology grounds it in history.
Long-Term Outlook and Economic Health: The Dow as a Reflection of Corporate America’s Resilience
Despite short-term volatility and economic cycles, the long-term trajectory of the Dow has been upward, mirroring the historical growth and resilience of the U.S. economy and its leading corporations. The index has weathered numerous crises—including two world wars, the Great Depression, the dot-com bubble, the 2008 financial crisis, and the COVID-19 pandemic—demonstrating the capacity of its constituent companies to innovate, adapt, and drive economic progress. From a macro perspective, sustained growth in the Dow over decades is a testament to the power of capitalism, technological advancement, and human ingenuity. Therefore, its performance isn’t just a numerical value; it’s a narrative of economic expansion and corporate resilience, offering a foundational element for a positive long-term investment outlook.

Personal Investment Implications: How Understanding the Dow Informs Individual Financial Decisions
For individual investors, understanding “what is today’s Dow Jones” is an exercise in financial literacy that informs broader decision-making. While it shouldn’t dictate every move, it provides a crucial context. A soaring Dow might indicate a strong bull market, encouraging investors to review their asset allocations and potentially trim over-performing sectors to rebalance. A declining Dow could signal market corrections or bear markets, prompting a re-evaluation of risk exposure and potentially identifying opportunities for long-term buying at lower prices.
More broadly, staying informed about the Dow’s performance cultivates a greater understanding of market dynamics, economic indicators, and the factors that influence investment returns. It empowers individuals to engage more intelligently with their financial advisors, scrutinize investment news with a critical eye, and make more confident decisions about their savings, retirement planning, and wealth accumulation goals. The Dow, ultimately, is more than just a number; it’s a window into the financial world, offering valuable insights for anyone navigating their personal financial journey.
aViewFromTheCave is a participant in the Amazon Services LLC Associates Program, an affiliate advertising program designed to provide a means for sites to earn advertising fees by advertising and linking to Amazon.com. Amazon, the Amazon logo, AmazonSupply, and the AmazonSupply logo are trademarks of Amazon.com, Inc. or its affiliates. As an Amazon Associate we earn affiliate commissions from qualifying purchases.