
The Year-to-Date (YTD) return of the S&P 500 is one of the most frequently cited and critical metrics for investors, financial professionals, and even the general public seeking to understand the health and direction of the U.S. stock market. It offers a crucial snapshot of market performance from the beginning of the calendar year up to the current date. For many, it acts as a quick pulse check on their investments and a barometer of economic sentiment. Understanding what this figure represents, how it’s calculated, and its implications is fundamental to making informed financial decisions and interpreting broader economic trends.
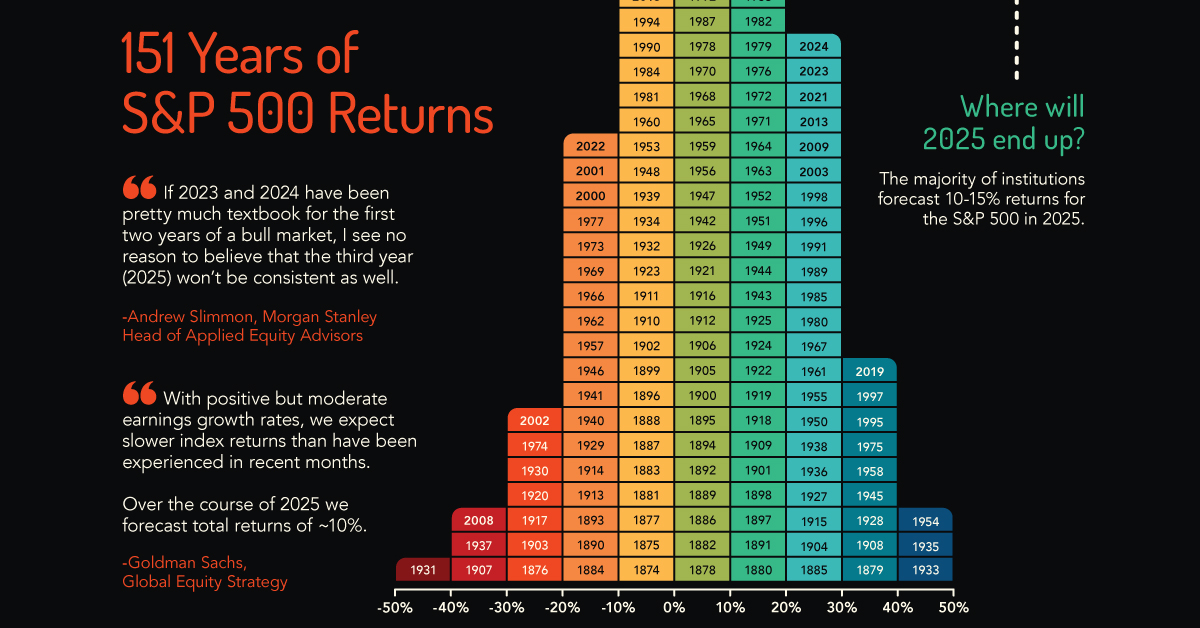
The S&P 500, often simply called “the S&P,” is an index composed of 500 of the largest publicly traded companies in the United States, selected by S&P Dow Jones Indices. It is widely regarded as one of the best gauges of large-cap U.S. equities and the overall health of the American economy. Consequently, its YTD performance is not just a number; it’s a narrative woven from corporate earnings, economic policies, investor sentiment, and global events that have transpired since January 1st. In a dynamic financial landscape, grasping this return allows investors to contextualize their portfolio’s performance, assess market momentum, and consider potential adjustments to their strategies.
Understanding Year-to-Date (YTD) Returns
The concept of Year-to-Date (YTD) is straightforward yet powerful in financial analysis. It provides a standardized period for measuring performance, making comparisons easier and trends more discernible. For an index like the S&P 500, its YTD return tells us how much the value of that index has changed since the first trading day of the current calendar year.
Defining YTD for Financial Metrics
At its core, “Year-to-Date” refers to the period from the beginning of the current calendar year (January 1st) up to the current date. If today is June 30th, the YTD period would cover January 1st to June 30th. This fixed starting point makes YTD returns particularly useful for tracking progress throughout a single year and comparing different assets or indices over the same timeframe. The calculation typically involves taking the current value of an asset or index, subtracting its value on January 1st, dividing by the January 1st value, and multiplying by 100 to express it as a percentage. For instance, if the S&P 500 started the year at 4,000 points and is currently at 4,400 points, its YTD return would be ((4,400 – 4,000) / 4,000) * 100 = 10%.
Why YTD Matters to Investors
YTD performance offers several critical insights for investors. Firstly, it provides an immediate, easily digestible snapshot of recent market performance. Unlike annual returns, which require waiting until December 31st, YTD figures are available daily, offering a continuous update on how the market is trending within the current year. This real-time perspective helps investors gauge the market’s current momentum. Secondly, it serves as a common benchmark. When an investor checks their portfolio, they often compare its YTD performance against that of the S&P 500. This comparison helps them assess whether their investments are outperforming, underperforming, or tracking the broader market. Finally, YTD returns can sometimes hint at short-term trends or shifts in market sentiment, prompting investors to delve deeper into the underlying factors driving performance.
The S&P 500: A Benchmark of US Market Health
The S&P 500 is not just any stock market index; it is arguably the most recognized and influential benchmark for large-cap U.S. equities. Comprising 500 leading companies across various sectors, it represents approximately 80% of the total market capitalization of the U.S. stock market. Unlike the Dow Jones Industrial Average, which is price-weighted, the S&P 500 is market-capitalization weighted, meaning companies with larger market values have a greater impact on the index’s performance. This weighting method makes it a more comprehensive and accurate reflection of the overall health of the U.S. economy and corporate America. Its broad diversification across industries—from technology and finance to healthcare and consumer staples—makes its performance an excellent indicator of general economic conditions and investor confidence.
Factors Influencing S&P 500 Performance
The S&P 500’s year-to-date return is not a random number; it’s the culmination of countless forces acting upon the market. These factors range from macroeconomic indicators to geopolitical developments, all contributing to the ebb and flow of stock prices. Understanding these influences is crucial for anyone trying to interpret market movements and anticipate future trends.
Economic Indicators
The health of the broader economy is a primary driver of corporate profitability and, by extension, stock market performance. Key economic indicators frequently influence the S&P 500. Gross Domestic Product (GDP) growth reflects overall economic expansion or contraction. Inflation, measured by indices like the Consumer Price Index (CPI), impacts purchasing power and corporate costs. Interest rates, particularly those set by the Federal Reserve, influence borrowing costs for businesses and consumers, affecting investment and spending. Strong employment data typically signals a healthy economy, while weak numbers can spark concerns. Consumer spending, which accounts for a significant portion of economic activity, also directly impacts the revenues of many S&P 500 companies. Positive trends in these areas generally support a rising S&P 500, while negative trends can lead to declines.
Corporate Earnings and Guidance
At the heart of stock prices are the earnings of the underlying companies. The S&P 500’s performance is heavily influenced by the aggregate profitability of its 500 constituents. When companies report strong earnings—meaning they’ve made more money than analysts expected—their stock prices often rise, pushing the index up. Equally important is corporate guidance, which refers to a company’s projections for future earnings and revenue. Optimistic guidance can signal future growth, while conservative or downgraded outlooks can trigger market sell-offs. Sector-specific performance also plays a role; a boom in the technology sector, for example, can significantly boost the S&P 500 due to the high market capitalization of its tech giants.
Geopolitical Events and Global Trends
The modern financial world is interconnected, meaning events far beyond U.S. borders can profoundly impact the S&P 500. Geopolitical events, such as international conflicts, trade disputes, or political instability in major economies, can create uncertainty, disrupt supply chains, and affect commodity prices, all of which trickle down to corporate bottom lines. Global trends like shifts in energy prices, the emergence of new technologies, or widespread health crises (like pandemics) can also significantly influence market sentiment and economic activity worldwide. For instance, rising oil prices can squeeze corporate profits and consumer discretionary spending, while a global recession can dampen demand for U.S. goods and services.
Market Sentiment and Investor Behavior
Beyond hard economic data and corporate fundamentals, the collective psychology of investors, known as market sentiment, plays a substantial role. Fear and greed are powerful emotions that can drive market behavior, sometimes irrationally. Positive sentiment, often fueled by optimism about the economy or technological breakthroughs, can lead to buying sprees and “bull runs.” Conversely, negative sentiment, perhaps triggered by bad news or economic uncertainty, can lead to panic selling and “bear markets.” Herd mentality, where investors follow the actions of the majority, can amplify these movements. Technical analysis, which studies past market data, also influences trading decisions, as many investors use chart patterns and indicators to predict future price movements, thus reinforcing certain trends.
Accessing and Interpreting Current YTD S&P Returns
In today’s information-rich environment, accessing the current YTD S&P return is relatively easy. However, interpreting that number effectively requires understanding the nuances of how it’s presented and contextualizing it within a broader investment strategy. Simply seeing a percentage gain or loss doesn’t tell the whole story.
Reliable Data Sources
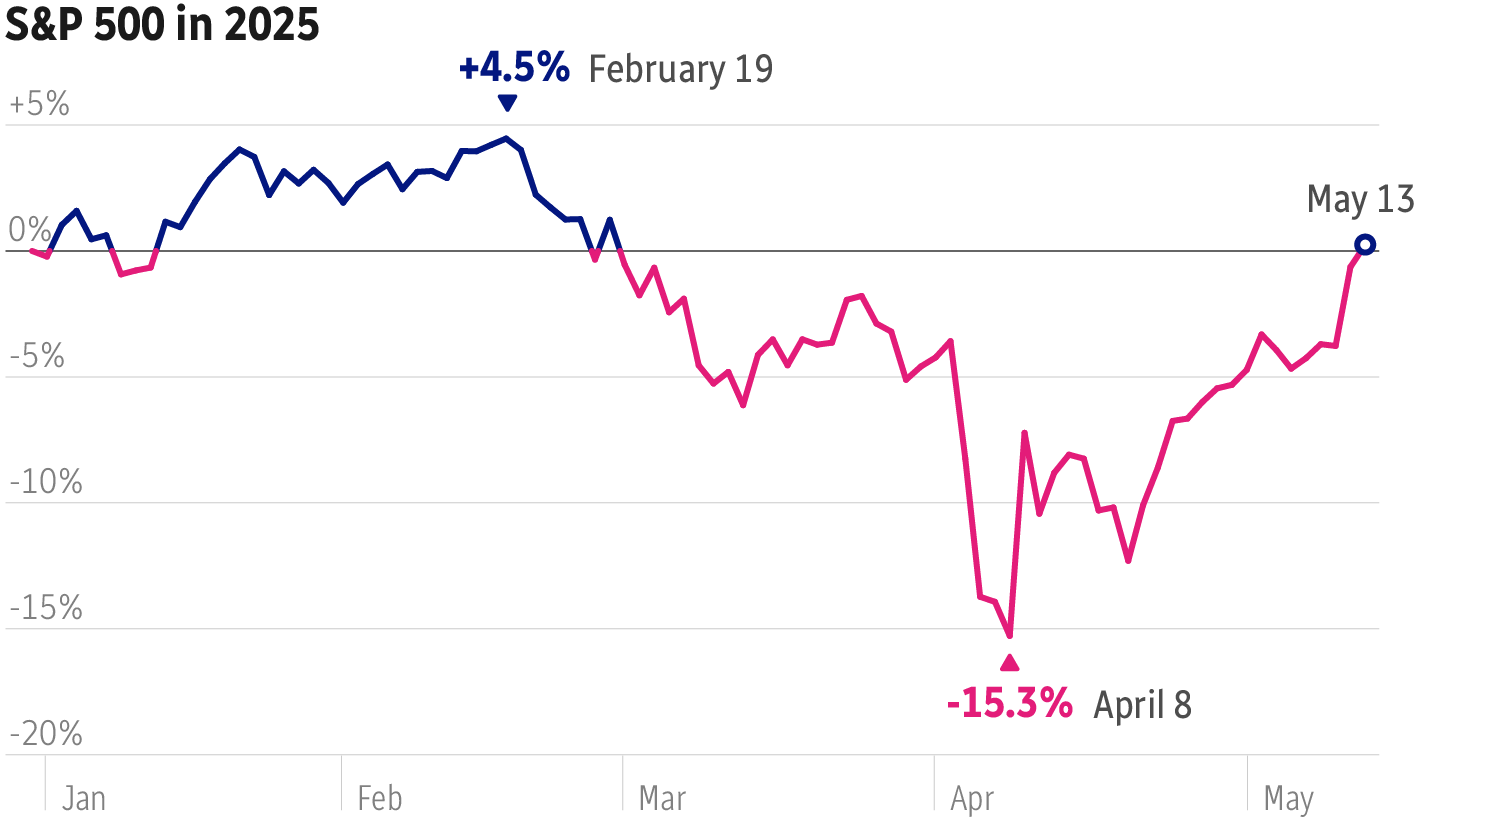
To get the most accurate and up-to-date YTD S&P 500 return, investors should rely on reputable financial news outlets and data providers. Websites like Bloomberg, Reuters, The Wall Street Journal, and Yahoo Finance are excellent sources, often displaying the current index level and its YTD change prominently. Major brokerage platforms (e.g., Fidelity, Schwab, Vanguard) also provide this data for their clients. For direct official information, the S&P Global website (the parent company of the index) offers comprehensive data and historical performance. It’s wise to cross-reference data from a couple of sources, especially during volatile market periods, to ensure accuracy. Most of these platforms update their figures in real-time during market hours and provide closing figures after the market closes.
Distinguishing Between Price Return and Total Return
One critical distinction when looking at S&P 500 returns is between “price return” and “total return.”
-
Price Return: This refers solely to the change in the index’s value based on the fluctuations of its component stock prices. It does not account for dividends paid out by the companies within the index.
-
Total Return: This is generally considered a more accurate representation of an investor’s actual return, as it includes both the capital appreciation (price change) and the reinvestment of any dividends paid by the constituent companies. For long-term investors, total return is usually the preferred metric because dividends historically contribute a significant portion to overall equity returns. When checking S&P 500 performance, ensure you know whether the figure quoted is price return or total return, and typically, the total return version gives a more complete picture of investment performance.
Contextualizing the YTD Figure
A raw YTD S&P 500 return, whether positive or negative, needs context to be truly meaningful.
-
Historical Averages: How does the current YTD return compare to the S&P 500’s historical average annual returns (which historically hover around 10-12% for total return over very long periods)? A 5% YTD return in June might seem low if the expectation is 10% for the full year, but it might be considered strong if the market has faced significant headwinds.
-
Other Indices: Compare the S&P 500 YTD performance to other major indices like the Dow Jones Industrial Average (DJIA), Nasdaq Composite, or even international indices. This can reveal whether the performance is broad-based or specific to large-cap U.S. stocks.
-
Individual Portfolio Performance: Use the S&P 500 YTD as a benchmark for your own diversified portfolio. If your portfolio is significantly underperforming the S&P 500 (assuming you invest in a similar risk profile), it might warrant further investigation.
-
Future Outlook: Consider the YTD return in light of current economic forecasts, Federal Reserve policy, and analyst predictions for the remainder of the year. A strong YTD might signal overheating, while a weak one might suggest a buying opportunity or a deeper issue.
Implications for Investors and Financial Planning
The year-to-date S&P 500 return provides a valuable data point, but its implications for individual investors and their financial planning are nuanced. It’s crucial not to overreact to short-term numbers but rather integrate them into a broader, long-term investment strategy.
Short-Term vs. Long-Term Perspective
One of the most common pitfalls for investors is focusing too heavily on short-term performance metrics like YTD returns. While interesting and potentially indicative of immediate market trends, a single year-to-date figure does not define an investor’s long-term financial success. The S&P 500, like all equity markets, experiences cycles of ups and downs. A strong YTD might be followed by a correction, and a weak YTD could precede a rebound. Astute investors understand that true wealth creation through equities is a marathon, not a sprint, and is achieved over decades, not months. Therefore, while monitoring YTD is fine, basing significant financial decisions solely on it can be detrimental.
Portfolio Review and Rebalancing
The YTD S&P 500 return can serve as a catalyst for a periodic portfolio review. If the S&P 500 has had a particularly strong YTD, it might mean that your equity allocation has grown beyond your target percentage, making your portfolio riskier than intended. Conversely, a poor YTD might indicate that your equity holdings have shrunk relative to other asset classes. In such scenarios, rebalancing your portfolio becomes important. Rebalancing involves selling off some assets that have performed well to buy more of those that have underperformed, bringing your portfolio back to its original target asset allocation. This disciplined approach helps manage risk and maintains your desired investment profile.
Investment Strategy Adjustments (or Lack Thereof)
For most long-term investors, the YTD S&P 500 return should rarely trigger a complete overhaul of their investment strategy. Strategies like dollar-cost averaging (investing a fixed amount regularly, regardless of market movements) and maintaining a diversified portfolio are designed to weather market fluctuations. A strong YTD might reinforce the benefits of staying invested, while a negative YTD could highlight opportunities to buy assets at lower prices. The key is to stick to a well-researched, personalized investment plan. However, significant and sustained shifts in market conditions, potentially hinted at by YTD performance, might prompt a review of specific sector allocations or a deeper dive into the economic outlook to ensure your strategy remains aligned with your goals and risk tolerance.
Behavioral Finance Considerations
Market performance, particularly readily available metrics like YTD returns, can significantly impact investor psychology. Behavioral finance studies how psychological factors influence financial decision-making. A positive YTD S&P 500 return can induce overconfidence or “FOMO” (fear of missing out), leading to impulsive buying at market peaks. Conversely, a negative YTD can trigger fear and panic selling, causing investors to lock in losses. Recognizing these emotional biases is crucial. A professional, insightful approach involves acknowledging these feelings but making decisions based on rational analysis, long-term goals, and a disciplined investment plan, rather than succumbing to emotional swings driven by current market numbers.
Looking Beyond the Current YTD: Future Outlook and Broader Market Trends
While the current Year-to-Date S&P 500 return provides a snapshot of the present, savvy investors understand that the market is always forward-looking. To truly harness the power of this metric, it’s essential to consider it within the context of future expectations and broader market trends.
Analyst Projections and Market Forecasts
After observing the YTD S&P 500 performance, many investors turn to analyst projections and market forecasts for insights into what the remainder of the year—and even beyond—might hold. Reputable financial institutions and research firms publish outlooks that incorporate various economic models, corporate earnings expectations, and expert opinions on monetary policy, inflation, and global events. These forecasts often include price targets for the S&P 500, offering a potential trajectory for the index. While no forecast is guaranteed, reviewing a range of expert opinions can help investors form a more comprehensive picture of potential future scenarios and gauge market sentiment regarding upcoming challenges and opportunities.
The Role of Diversification
The S&P 500’s YTD return, while highly indicative of the U.S. large-cap equity market, doesn’t tell the entire story for a well-diversified portfolio. A robust investment strategy typically includes exposure to various asset classes (e.g., bonds, real estate, commodities), different market capitalizations (small-cap, mid-cap stocks), and international equities. Even within equities, diversification across sectors and industries is vital. For example, if the S&P 500’s YTD performance is heavily skewed by a few mega-cap tech stocks, a truly diversified portfolio might have a different return profile. Therefore, investors should use the S&P 500 YTD as one piece of the puzzle, assessing it in conjunction with the performance of their broader, diversified holdings.
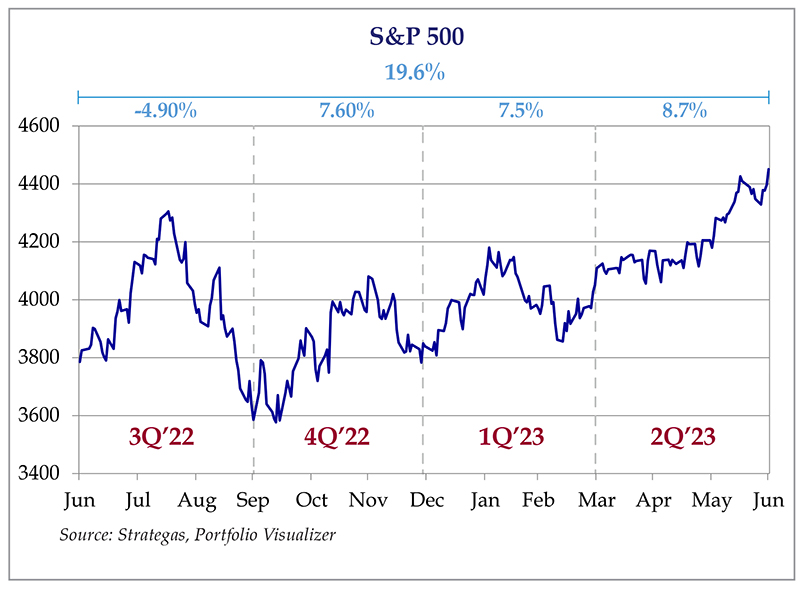
Preparing for Volatility
Perhaps the most consistent truth in investing is the inevitability of market volatility. Whether the S&P 500’s YTD return is positive or negative, investors should always be prepared for fluctuations. Markets can pivot quickly in response to unforeseen events, policy changes, or shifts in investor sentiment. Building a resilient portfolio involves understanding one’s risk tolerance, maintaining an emergency fund, investing across different asset classes, and having a long-term mindset. When the market experiences significant swings, those prepared for volatility are less likely to make rash decisions and are better positioned to weather the storm and potentially capitalize on opportunities.
In conclusion, the Year-to-Date S&P 500 return is a powerful and frequently referenced indicator of the U.S. stock market’s performance. It provides a real-time snapshot of how large-cap American companies are faring from January 1st to the current date, influenced by a complex interplay of economic data, corporate health, global events, and investor sentiment. While crucial for contextualizing one’s portfolio and understanding market trends, it’s imperative for investors to interpret this figure with a balanced, long-term perspective. Relying on credible sources, understanding the distinction between price and total return, and consistently placing the YTD figure within a broader financial and historical context are key. Ultimately, while tracking this metric is valuable for awareness, successful financial planning hinges on disciplined execution of a well-diversified strategy that prioritizes long-term goals over short-term market noise.
aViewFromTheCave is a participant in the Amazon Services LLC Associates Program, an affiliate advertising program designed to provide a means for sites to earn advertising fees by advertising and linking to Amazon.com. Amazon, the Amazon logo, AmazonSupply, and the AmazonSupply logo are trademarks of Amazon.com, Inc. or its affiliates. As an Amazon Associate we earn affiliate commissions from qualifying purchases.