
The year 2016 stands as a significant milestone in American economic history, particularly concerning the trajectory of federal fiscal policy. During this period, the United States national debt became a focal point of intense political debate, economic analysis, and global financial scrutiny. As the nation navigated the final year of the Obama administration and moved through a high-stakes presidential election, the “red ink” on the national ledger reached levels that triggered both alarm and academic curiosity. To understand what the US national debt was in 2016, one must look beyond the raw numbers and examine the underlying fiscal mechanics, the debt-to-GDP ratio, and the implications for the broader economy.
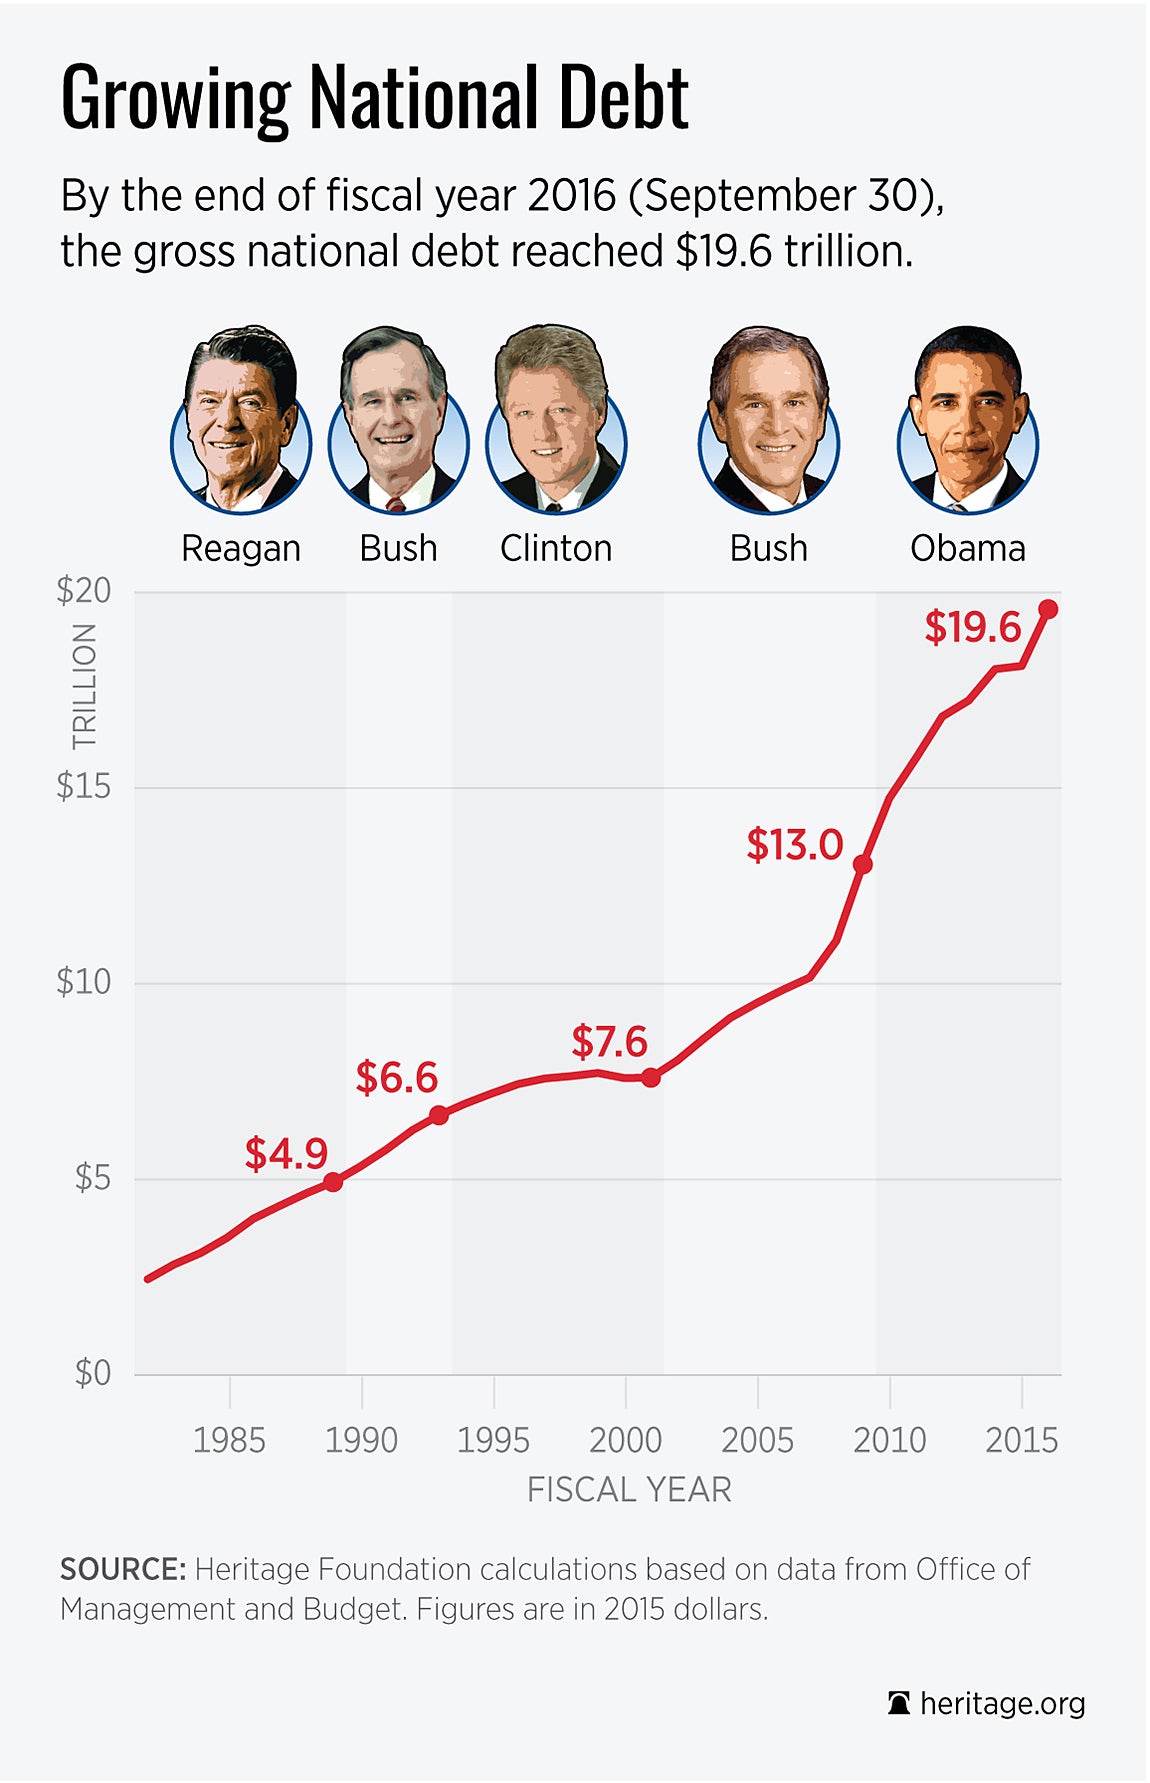
By the end of the 2016 fiscal year, the total outstanding public debt of the United States reached approximately $19.57 trillion. This figure represented a significant increase from the roughly $10 trillion seen at the start of the Great Recession in 2008. The crossing of the $19 trillion threshold in early 2016 served as a psychological and political catalyst, forcing a re-evaluation of how the world’s largest economy manages its obligations.
The Raw Numbers: Breaking Down the $19.5 Trillion Mark
To grasp the magnitude of the national debt in 2016, it is essential to distinguish between the two primary types of debt that constitute the total figure: debt held by the public and intragovernmental holdings.
Debt Held by the Public
In 2016, debt held by the public accounted for roughly $14.17 trillion of the total. This portion represents the securities—such as Treasury bills, notes, and bonds—held by individuals, corporations, the Federal Reserve, state and local governments, and foreign entities. Because this debt is traded in global markets, it is often considered the most relevant metric for assessing the government’s impact on the credit markets and the economy at large.
Intragovernmental Holdings
The remaining $5.4 trillion consisted of intragovernmental holdings. This is debt that the Treasury owes to other parts of the federal government, primarily trust funds for programs like Social Security and Medicare. While this is often described as the government “borrowing from itself,” it represents a legal obligation to pay future benefits, making it a critical component of the nation’s long-term financial health.
The Pace of Growth
The growth of the debt in 2016 was driven by a federal budget deficit of approximately $587 billion for the fiscal year. While this was significantly lower than the $1 trillion-plus deficits recorded during the peak of the financial crisis recovery (2009–2012), it marked the first time the deficit had increased as a share of the economy since 2011. This reversal signaled that the era of post-recession “deficit contraction” had come to an end, largely due to rising spending on mandatory programs and a plateauing of tax revenues.
The Debt-to-GDP Ratio: Measuring the Economic Burden
Economists often argue that the nominal dollar amount of debt is less important than the debt-to-GDP ratio. This ratio compares what a country owes to what it produces, providing a sense of the nation’s ability to “afford” its debt.
Historical Context and 2016 Benchmarks
In 2016, the US debt-to-GDP ratio sat at approximately 105% for the total debt and roughly 76% for debt held by the public. For context, before the 2008 financial crisis, the debt-to-GDP ratio for debt held by the public was closer to 35%. The dramatic rise over the intervening eight years was a result of aggressive fiscal stimulus, lower tax receipts during the recession, and the onset of the “silver tsunami”—the retirement of the Baby Boomer generation.
Comparison with Global Peers
While 105% may seem high, the US was not alone in its debt struggles in 2016. Japan’s debt-to-GDP ratio exceeded 230%, and several European nations faced ratios well over 100%. However, because the US dollar serves as the world’s primary reserve currency, the United States maintained a unique advantage: high demand for Treasury securities. This “exorbitant privilege” allowed the US to continue borrowing at historically low interest rates despite the mounting debt load.
The Role of Interest Rates
One of the most fascinating aspects of the 2016 debt landscape was the cost of servicing that debt. Despite the principal being at an all-time high, the actual interest payments were relatively manageable. This was due to the Federal Reserve’s “lower for longer” interest rate policy. In 2016, the effective interest rate on the total debt was roughly 2.2%. This environment allowed the government to carry a much larger debt load than would have been possible in a high-interest-rate era, like the 1980s.

Drivers of Federal Spending and Revenue in 2016
To understand why the debt reached nearly $20 trillion by the end of 2016, one must analyze the components of the federal budget. The fiscal year 2016 budget was characterized by a push-and-pull between mandatory spending, discretionary outlays, and revenue fluctuations.
Mandatory Spending: Social Security and Healthcare
The primary drivers of the 2016 debt were “mandatory” programs. Unlike discretionary spending, which must be approved by Congress each year, mandatory spending is baked into existing law.
- Social Security: As more Baby Boomers reached retirement age, Social Security outlays continued to climb, accounting for nearly 24% of all federal spending.
- Healthcare: Medicare and Medicaid together accounted for about 25% of the budget. The rising cost of healthcare services, combined with an aging population, made these programs the fastest-growing segments of the national debt.
Discretionary Spending and Defense
Discretionary spending, which includes everything from education to transportation, accounted for about 30% of the 2016 budget. Within this category, defense spending was the largest item, totaling roughly $584 billion. The 2016 fiscal year saw a slight increase in defense spending as the US continued operations in the Middle East and addressed emerging geopolitical challenges.
Revenue Shortfalls
On the other side of the ledger, federal revenue for 2016 totaled approximately $3.27 trillion. While this was a record high in nominal terms, it did not keep pace with the growth in spending. Corporate tax receipts were particularly weak in 2016, falling by about 13% compared to the previous year. Economists attributed this to a slowdown in corporate profits and various tax loopholes, which contributed to the widening of the deficit.
The Political and Economic Implications of 2016 Fiscal Policy
The $19.5 trillion debt was not just a spreadsheet entry; it was a central theme of the 2016 political cycle and had tangible effects on financial markets.
The 2016 Election Discourse
Throughout the 2016 presidential campaign, candidates Donald Trump and Hillary Clinton offered vastly different visions for managing the national debt. The Republican platform generally emphasized tax cuts and deregulation as a means to “grow our way out of debt,” while the Democratic platform focused on tax increases for high earners and strategic investments in infrastructure. This debate highlighted a fundamental disagreement in American politics: whether the debt is a “looming crisis” that requires immediate austerity or a manageable tool that can be used to fuel economic progress.
The Debt Ceiling and Market Stability
The year 2016 was also marked by the temporary suspension of the debt ceiling. Under the Bipartisan Budget Act of 2015, the debt limit was suspended until March 2017. This allowed the Treasury to continue borrowing without the threat of a default, providing a period of relative market stability. Investors viewed US Treasuries as a “safe haven,” especially amidst global volatility such as the Brexit vote in the United Kingdom.
Long-term Fiscal Sustainability
Despite the temporary stability, 2016 served as a warning year for fiscal hawks. The Congressional Budget Office (CBO) released reports during the year suggesting that if current laws remained unchanged, the debt would continue to grow faster than the economy over the next 30 years. This raised concerns about “crowding out”—the idea that high levels of government borrowing would eventually lead to higher interest rates for private borrowers, potentially stifling innovation and capital investment.

Conclusion: The Legacy of the 2016 Debt
The state of the US national debt in 2016 represents a pivotal moment in modern finance. It was a year where the debt transitioned from a post-crisis recovery issue to a structural reality of the 21st-century American economy. With the debt crossing $19 trillion and closing in on $20 trillion, the year 2016 proved that the US could sustain high levels of borrowing so long as interest rates remained low and the dollar remained the global standard.
However, 2016 also underscored the challenges of a bifurcated budget where mandatory spending on an aging population puts perpetual pressure on the deficit. For personal finance enthusiasts and professional investors, the 2016 debt figures served as a reminder of the importance of monitoring federal policy. The fiscal decisions made during this year set the stage for the tax reforms and spending increases of the subsequent years, eventually leading to the even more dramatic debt expansions of the 2020s.
Ultimately, the $19.5 trillion debt of 2016 was more than just a number—it was a reflection of America’s economic priorities, its demographic shifts, and its role as the anchor of the global financial system. Understanding this period is crucial for anyone looking to navigate the complexities of modern business finance and the ever-evolving landscape of the American economy.
aViewFromTheCave is a participant in the Amazon Services LLC Associates Program, an affiliate advertising program designed to provide a means for sites to earn advertising fees by advertising and linking to Amazon.com. Amazon, the Amazon logo, AmazonSupply, and the AmazonSupply logo are trademarks of Amazon.com, Inc. or its affiliates. As an Amazon Associate we earn affiliate commissions from qualifying purchases.