
In the intricate world of finance, where every decision is a calculated risk and every opportunity is weighed against potential downturns, understanding the tools that measure uncertainty is paramount. One such indispensable statistical measure is standard deviation. Often cited in investment prospectuses, economic reports, and financial news, it’s a cornerstone for assessing risk and volatility. Yet, for many, the seemingly simple question—”What is the unit for standard deviation?”—remains a point of confusion, obscuring its profound implications for personal finance, investing, and business strategy.
The straightforward answer is that the unit for standard deviation is the same as the unit of the data set itself. If you’re measuring stock prices in dollars, the standard deviation will be in dollars. If you’re analyzing portfolio returns in percentages, the standard deviation will be in percentage points. This direct correspondence is crucial, for it allows financial professionals and individual investors alike to interpret risk in tangible, relatable terms, directly tied to the metrics they are evaluating. This article will delve into the essence of standard deviation, its pivotal role in the financial domain, and how its unit empowers smarter monetary decisions.

The Core Concept: Understanding Standard Deviation
At its heart, standard deviation is a measure of the dispersion or spread of a set of data points around its mean (average). In simpler terms, it tells you, on average, how far each data point deviates from the typical value. A low standard deviation indicates that the data points tend to be close to the mean, while a high standard deviation indicates that the data points are spread out over a wider range.
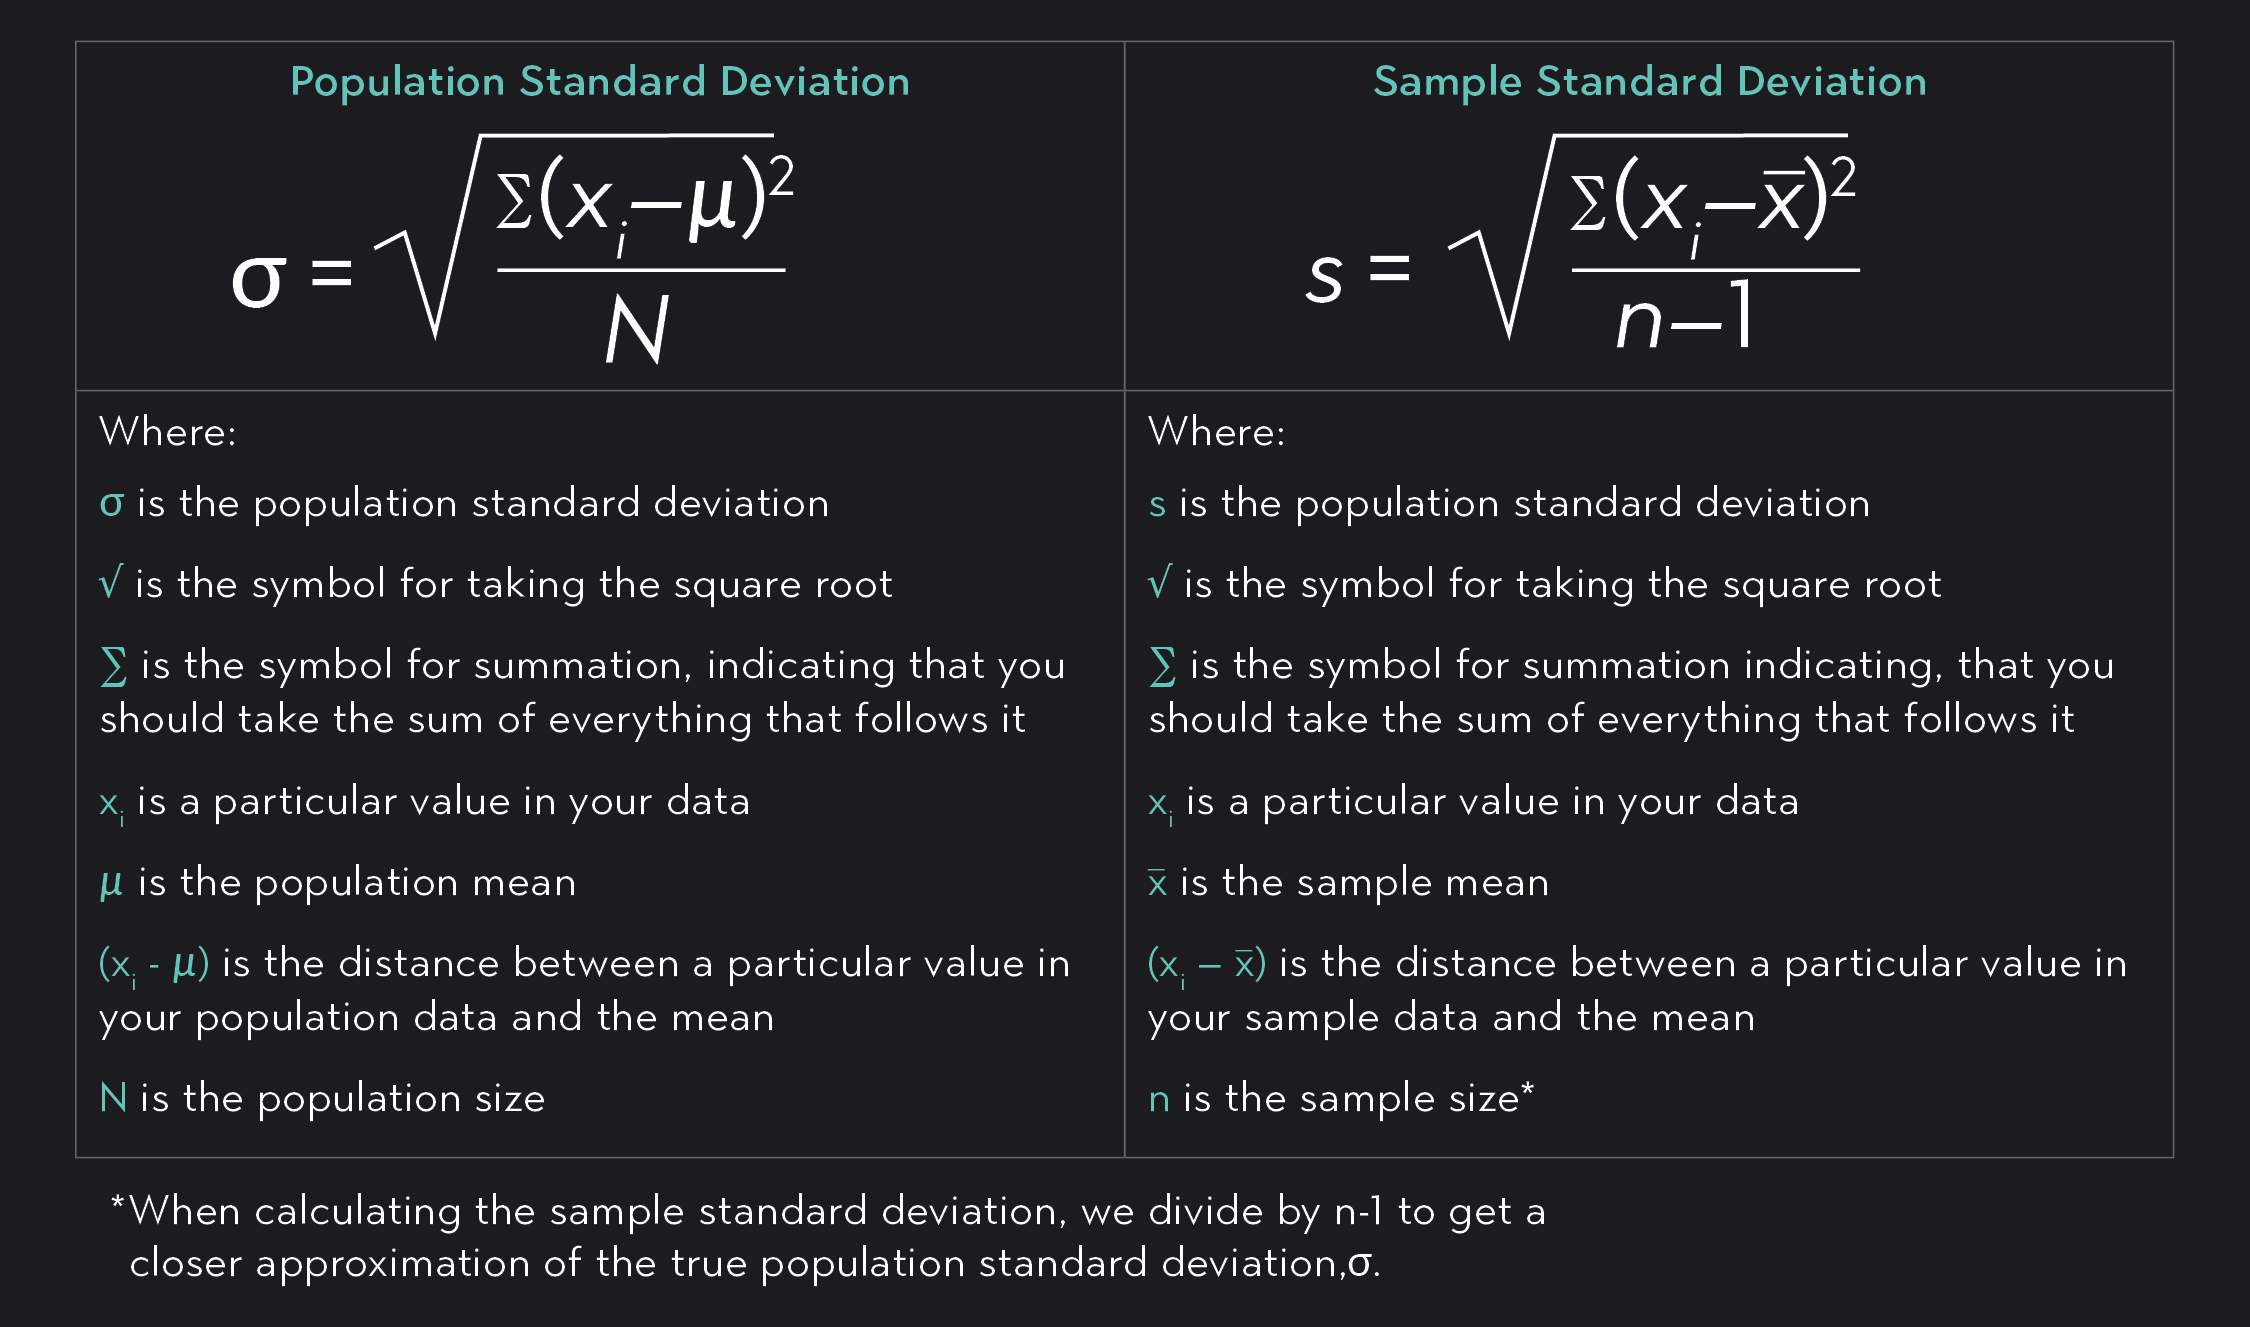
Mathematically, it is the square root of the variance, which itself is the average of the squared differences from the mean. While the formula might appear daunting, the concept is intuitive: it quantifies the typical variability within a dataset.
Beyond the Definition: Why It Matters in Finance
For financial practitioners, standard deviation transcends a mere statistical curiosity; it’s a critical indicator of risk. In the realm of money, “risk” often correlates with “volatility”—the degree of variation of a trading price series over time. Whether you’re tracking stock prices, bond yields, currency exchange rates, or the returns of a mutual fund, a higher standard deviation signals greater price fluctuations and, consequently, higher risk. Conversely, a lower standard deviation suggests more stable prices or returns and lower risk.
This understanding forms the bedrock for numerous financial theories and practical applications, from modern portfolio theory to individual investment selection. It enables a quantifiable assessment of the unpredictable nature inherent in financial markets, moving beyond subjective gut feelings to data-driven insights.
Deciphering the Unit: A Financial Lens
As established, the unit of standard deviation mirrors the unit of the underlying data. This seemingly simple fact has profound implications for how we perceive and manage financial risk. When we discuss financial assets or ventures, the units typically involve monetary values (dollars, euros, yen), percentages (returns, interest rates), or other quantifiable financial metrics.
Standard Deviation and Financial Volatility
Consider an investment’s annual returns, measured in percentages. If a stock has an average annual return of 10% and a standard deviation of 15%, this standard deviation is expressed as “15 percentage points.” This doesn’t mean the return could be 15%, but rather that its returns typically vary by about 15 percentage points from its 10% average. So, one might expect returns to typically fall between -5% (10% – 15%) and 25% (10% + 15%) for roughly 68% of the time, assuming a normal distribution.
Similarly, if you’re analyzing the daily closing price of a stock, measured in dollars, and its standard deviation is $2.50, then its typical daily price fluctuation is around $2.50 from its average. This direct unit alignment makes the measure immediately actionable for assessing potential price swings.
Expressing Risk: The Unit in Action
The unity of units allows for an apples-to-apples comparison of risk across different financial instruments or business segments, provided the underlying data is measured in the same unit. For instance, if two mutual funds both report their returns in percentages, their respective standard deviations (also in percentage points) can be directly compared to gauge which fund has historically been more volatile.
This also applies to analyzing business finances. If a company’s monthly revenues are measured in thousands of dollars, a standard deviation of $50,000 indicates the typical fluctuation in its monthly revenue. This information is critical for budgeting, forecasting, and managing cash flow. The explicit unit ensures that risk is not an abstract concept but a quantifiable deviation from expected financial outcomes.
Practical Applications in Money Management
The ability to quantify risk using standard deviation, with its easily interpretable unit, makes it an indispensable tool across various facets of money management.
Portfolio Risk Assessment
For investors, standard deviation is a cornerstone of portfolio management. It helps assess the overall risk profile of an investment portfolio. By calculating the standard deviation of individual assets within a portfolio, and considering their correlations, investors can understand the portfolio’s aggregated volatility. A portfolio with a high standard deviation suggests greater potential for large swings in value, which might be suitable for risk-tolerant investors but unsuitable for those nearing retirement who prioritize capital preservation.
Financial advisors frequently use standard deviation to tailor portfolios to a client’s specific risk tolerance. If a client is highly risk-averse, the advisor might recommend a portfolio composed of assets with lower standard deviations (e.g., bonds, stable dividend stocks) to minimize volatility and protect capital.
Comparing Investment Opportunities
When faced with multiple investment choices—be it stocks, bonds, real estate, or alternative investments—standard deviation provides an objective metric for comparison. An investor might analyze two stocks, both with similar average returns but vastly different standard deviations. Stock A, with an average annual return of 12% and a standard deviation of 8%, would be considered less risky than Stock B, which also has a 12% average return but a standard deviation of 20%. Both returns are in percentage points, so their standard deviations are also directly comparable in percentage points.
This comparative power extends to assessing risk-adjusted returns through metrics like the Sharpe Ratio, which uses standard deviation in its denominator. While the Sharpe Ratio itself is unitless, it leverages the standard deviation’s unit-conformity to effectively measure the excess return per unit of risk, providing a more holistic view of an investment’s attractiveness.
Business Performance Analysis
Beyond personal investing, standard deviation plays a vital role in corporate finance and business analysis. Businesses use it to analyze the variability of various financial metrics:
- Revenue Streams: Understanding the standard deviation of monthly or quarterly revenue can help businesses predict cash flow fluctuations and plan for lean periods.
- Operating Expenses: Analyzing the variability of costs (e.g., raw material prices, labor costs) allows businesses to better manage budgets and identify areas for cost control.
- Project Returns: When evaluating potential projects or capital expenditures, companies can use standard deviation to assess the expected volatility of projected returns, aiding in capital allocation decisions.
- Inventory Levels: For retail or manufacturing businesses, the standard deviation of sales can help optimize inventory levels, minimizing both stockouts and excessive carrying costs.
In all these scenarios, the unit of standard deviation remains consistent with the financial metric being analyzed, offering clear, actionable insights into business stability and risk exposure.
Interpreting the Numbers: What the Unit Tells You
Understanding that standard deviation shares the same unit as your data is just the first step. The true value lies in interpreting what these numbers, in their specific units, actually signify for your financial health or business strategy.
The Bell Curve and Financial Returns
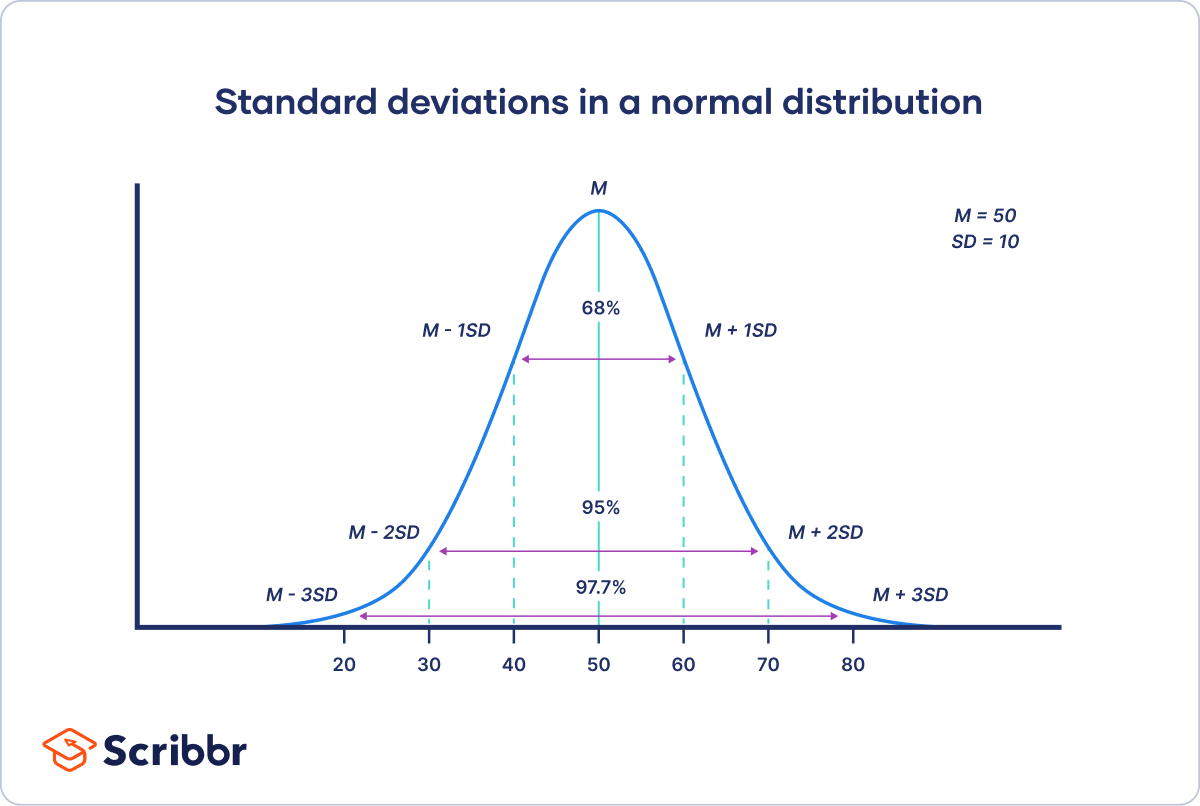
Assuming a normal distribution (the classic bell curve), standard deviation allows for probabilistic statements about financial outcomes. For instance, if a fund’s annual returns average 8% with a standard deviation of 5% (both in percentage points):
- Approximately 68% of the time, the annual returns would fall between 3% (8%-5%) and 13% (8%+5%).
- Approximately 95% of the time, returns would fall between -2% (8%-25%) and 18% (8%+25%).
- Approximately 99.7% of the time, returns would fall between -7% (8%-35%) and 23% (8%+35%).
This allows investors to quantify the range of possible outcomes and understand the likelihood of extreme events, such as significant losses or exceptionally high gains. The unit consistency makes these probabilistic statements directly applicable to monetary expectations.
Limitations and Complementary Metrics
While powerful, standard deviation is not without its limitations, particularly in finance. It assumes a symmetrical distribution of returns, which isn’t always the case for financial assets (e.g., stock returns often exhibit “fat tails,” meaning extreme events occur more frequently than a normal distribution would predict). Moreover, standard deviation treats both upside and downside volatility equally, but investors are typically more concerned with downside risk.
Therefore, financial analysis often complements standard deviation with other metrics. Value-at-Risk (VaR), for example, quantifies the maximum expected loss over a given period at a certain confidence level. Skewness and kurtosis help assess the asymmetry and “tailedness” of return distributions. Nevertheless, standard deviation remains a fundamental building block for these more advanced analyses, providing the basic measure of dispersion from which further insights are drawn.
Leveraging Standard Deviation for Smarter Financial Decisions
The unambiguous unit of standard deviation transforms it from an abstract statistical concept into a tangible tool for making informed financial decisions. It provides clarity and a common language for discussing and managing risk across various financial contexts.
Integrating SD into Your Investment Strategy
For individual investors, integrating standard deviation into their strategy means:
- Assessing Personal Risk Tolerance: Understanding your own comfort level with volatility helps you choose investments whose standard deviations align with your capacity for risk.
- Diversification: Combining assets with different standard deviations and low (or negative) correlations can help reduce overall portfolio standard deviation without necessarily sacrificing returns.
- Performance Evaluation: When reviewing investment performance, look beyond just returns. Consider the standard deviation to understand the “ride” you endured to achieve those returns. A lower standard deviation for a similar return often indicates a more efficient investment.
- Long-term Planning: For goals like retirement, where capital preservation becomes increasingly important, shifting towards assets with lower standard deviations as you approach your target date can help protect your nest egg from significant market swings.
Financial Tools and Standard Deviation
Modern financial software, online brokerage platforms, and robo-advisors widely incorporate standard deviation into their analytics. You’ll find it alongside other metrics like beta, Sharpe ratio, and alpha when researching stocks, ETFs, and mutual funds. These tools make it easier for even novice investors to access and understand an asset’s historical volatility, expressed in its natural unit.
By consciously seeking out and interpreting this metric, individuals can move beyond mere speculation, grounding their financial aspirations in a robust, data-driven understanding of risk. This empowers them to construct more resilient portfolios, make strategic business decisions, and ultimately navigate the complex financial landscape with greater confidence and foresight.
In conclusion, the simple answer to “What is the unit for standard deviation?”—that it’s the same as the data it measures—is foundational. This consistency allows standard deviation to act as a clear, quantifiable bridge between raw financial data and the critical decisions we must make about risk, investment, and wealth management. It is a fundamental truth that underpins intelligent financial literacy and strategic action.
aViewFromTheCave is a participant in the Amazon Services LLC Associates Program, an affiliate advertising program designed to provide a means for sites to earn advertising fees by advertising and linking to Amazon.com. Amazon, the Amazon logo, AmazonSupply, and the AmazonSupply logo are trademarks of Amazon.com, Inc. or its affiliates. As an Amazon Associate we earn affiliate commissions from qualifying purchases.