
The United States stock market serves as the primary engine of global finance, a sprawling ecosystem of capital where trillions of dollars change hands daily. For investors, economists, and policy makers, understanding the total value of this market is more than a matter of curiosity; it is a vital metric for assessing the health of the national economy and the relative valuation of financial assets. As of the mid-2020s, the aggregate value of the U.S. equity market typically fluctuates between $45 trillion and $55 trillion, depending on daily price movements and broader macroeconomic shifts.
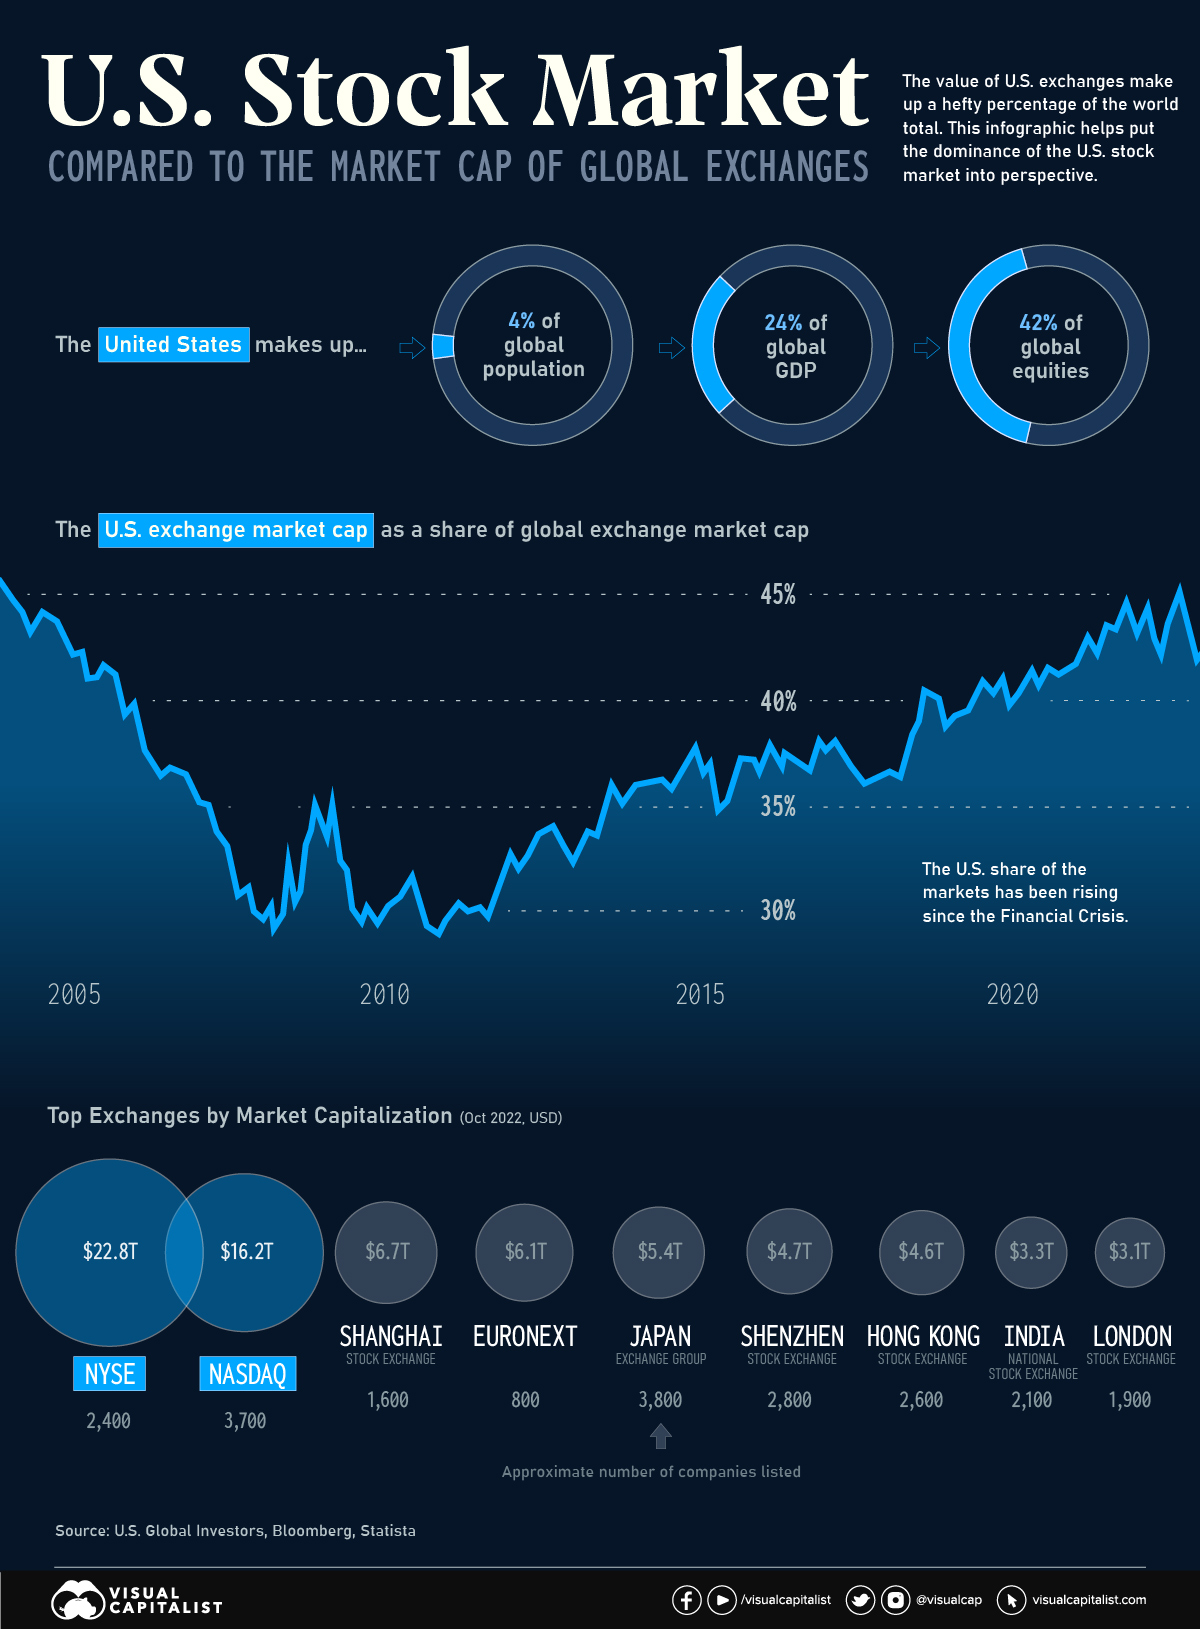
This total value, often referred to as “market capitalization” or “market cap,” represents the combined share price of all publicly traded companies across the major American exchanges. While the figure is constantly in flux, its scale remains unparalleled, accounting for nearly 40% to 50% of the total global equity market value. Understanding how this figure is calculated, what drives its growth, and why it matters is essential for anyone navigating the modern financial landscape.
Understanding Market Capitalization and the Scope of US Equities
To grasp the total value of the U.S. stock market, one must first understand the concept of market capitalization. At the individual company level, market cap is the total dollar market value of a company’s outstanding shares of stock. It is calculated by multiplying a company’s current share price by its total number of outstanding shares. When we speak of the “total market value,” we are essentially summing the market caps of every publicly traded company in the United States.
The Role of Major Exchanges: NYSE and NASDAQ
The U.S. market is primarily concentrated within two massive institutions: the New York Stock Exchange (NYSE) and the NASDAQ. The NYSE, located on Wall Street, is the world’s largest stock exchange by market capitalization and is home to many of the world’s oldest and most established “blue-chip” companies. It utilizes a traditional auction-based model, though it has modernized significantly.
The NASDAQ, conversely, is a global electronic marketplace. It is renowned for its concentration of high-growth technology and biotech firms. Together, these two exchanges host the vast majority of the equity value in the United States. When analysts calculate the total market value, they aggregate the data from these platforms, along with smaller regional exchanges and over-the-counter (OTC) markets, to arrive at a comprehensive figure.
The Wilshire 5000: The “Total Market” Benchmark
While many investors follow the Dow Jones Industrial Average or the S&P 500, these indices only track a fraction of the total market. To see the “total value,” professionals often look to the Wilshire 5000 Total Market Index. Despite its name, the index does not always contain exactly 5,000 stocks; rather, it tracks essentially all U.S.-headquartered companies with readily available price data. Because it is a float-adjusted, market-cap-weighted index, it provides the most accurate reflection of the total dollar value of the U.S. equity universe.
Current Valuations and the Concentration of Wealth
The total value of the U.S. stock market has experienced exponential growth over the last several decades. In the early 1990s, the total market cap was measured in the low trillions. By the early 2020s, that figure surged past $40 trillion, driven by technological innovation, low interest rates, and the expansion of global trade. However, this value is not distributed evenly across all participants.
The Dominance of Mega-Cap Technology
A defining characteristic of the modern U.S. market is the extreme concentration of value at the top. A small group of companies, often referred to as the “Magnificent Seven”—including Apple, Microsoft, Alphabet (Google), Amazon, NVIDIA, Meta (Facebook), and Tesla—account for a staggering percentage of the total market value. In recent years, these seven entities alone have represented upwards of 25% to 30% of the entire S&P 500’s market cap.
This concentration means that the “total value” of the market is highly sensitive to the performance of the tech sector. If the top five companies lose 10% of their value in a market correction, it can result in a loss of trillions of dollars in aggregate market cap, even if thousands of smaller “small-cap” companies remain stable.
Market Cap vs. GDP: The Buffett Indicator
One of the most popular ways to contextualize the total value of the U.S. stock market is by comparing it to the nation’s Gross Domestic Product (GDP). This ratio is famously known as the “Buffett Indicator,” named after legendary investor Warren Buffett, who once described it as “probably the best single measure of where valuations stand at any given moment.”

Historically, a ratio of 100% (where the total market cap equals the annual GDP) was seen as a sign of fair valuation. In the post-2020 era, this ratio has frequently climbed above 150% or even 190%. While some argue this indicates a massive bubble, others suggest that the U.S. market’s value is now more tied to global earnings than just domestic economic output, justifying a higher ratio.
Factors Influencing the Market’s Aggregate Value
The total value of the U.S. stock market is not a static number; it is a living reflection of collective expectations for the future. Several macro and microeconomic factors dictate whether the market’s total value expands or contracts.
Monetary Policy and Interest Rates
Perhaps the most significant driver of market value is the Federal Reserve’s monetary policy. When interest rates are low, borrowing costs for corporations decrease, allowing them to invest in growth and buy back shares. Furthermore, low interest rates make “safe” investments like bonds less attractive, pushing investors toward equities in search of higher returns. This increased demand drives up stock prices and, consequently, the total market value. Conversely, when the Fed raises rates to combat inflation, equity valuations often compress, leading to a reduction in the total market cap.
Corporate Earnings and Innovation
Ultimately, a stock represents a claim on a company’s future earnings. The total value of the market is, therefore, a reflection of the cumulative profitability of corporate America. Periods of high innovation—such as the internet boom of the late 90s or the current surge in Artificial Intelligence—create new “value” out of thin air. When companies like NVIDIA or Microsoft develop transformative technologies, their projected future cash flows skyrocket, adding trillions of dollars to the total market valuation without requiring a corresponding increase in physical assets.
Global Capital Flows and Geopolitics
The U.S. stock market is seen as a “safe haven” for global investors. In times of geopolitical instability in Europe or Asia, capital often flows into U.S. equities due to the stability of the U.S. legal system and the liquidity of its markets. This international demand provides a floor for U.S. valuations. However, shifts in global trade policy, currency fluctuations (specifically the strength of the U.S. Dollar), and international conflicts can create volatility that impacts the aggregate market value.
Why Total Market Value Matters for Individual Investors
For the average person, a figure like “$50 trillion” can feel abstract. However, the total value of the market has practical implications for retirement planning, wealth building, and risk management.
Diversification via Total Market Funds
The rise of passive investing has made the total market value highly relevant to individual portfolios. “Total Stock Market Index Funds” and ETFs (Exchange-Traded Funds), such as the Vanguard Total Stock Market ETF (VTI), allow investors to own a tiny piece of every single publicly traded company in the U.S. These funds are weighted by market cap, meaning the investor’s exposure is automatically balanced according to the total value of the market. This approach provides broad diversification and ensures that the investor captures the growth of the entire American economy rather than gambling on individual winners.
Sentiment and the “Wealth Effect”
The total value of the stock market also influences consumer behavior through the “wealth effect.” When the market cap of the U.S. exchanges rises, the value of 401(k)s and brokerage accounts increases. This makes households feel wealthier, which often leads to increased consumer spending, further boosting the economy. When the market value crashes, the reverse occurs: consumers tighten their belts, which can lead to or exacerbate economic recessions.

The Future of US Market Valuation
As we look toward the future, the total value of the U.S. stock market will likely continue to be the primary benchmark for global financial success. While critics point to high price-to-earnings ratios and historical deviations from GDP as signs of overvaluation, the U.S. market’s ability to reinvent itself through technology remains its greatest strength.
The transition toward a digital, AI-driven economy suggests that the “intangible value” of companies—their data, algorithms, and intellectual property—will represent an even larger share of the total market cap in the coming decades. Whether the market sits at $50 trillion or $100 trillion ten years from now will depend on the continued ability of U.S. corporations to innovate and the Federal Reserve’s ability to manage the delicate balance between growth and inflation.
In conclusion, the total value of the U.S. stock market is a staggering representation of the world’s most productive economy. It is a figure that encapsulates the labor, innovation, and capital of thousands of companies and millions of workers. By monitoring this aggregate value, investors can gain a high-level view of the financial climate, helping them make more informed decisions about where to allocate their capital in an increasingly complex world.
aViewFromTheCave is a participant in the Amazon Services LLC Associates Program, an affiliate advertising program designed to provide a means for sites to earn advertising fees by advertising and linking to Amazon.com. Amazon, the Amazon logo, AmazonSupply, and the AmazonSupply logo are trademarks of Amazon.com, Inc. or its affiliates. As an Amazon Associate we earn affiliate commissions from qualifying purchases.