
Demystifying Data Distribution for Financial Acumen
In the intricate world of finance, data is currency, and understanding its distribution is paramount to making informed decisions. Whether you’re a personal investor tracking portfolio performance, a small business owner analyzing sales trends, or a corporate CFO evaluating market risk, the ability to dissect and interpret data sets is a non-negotiable skill. While averages and medians provide a snapshot, they often fail to capture the full story of variability and concentration within your financial data. This is where quartiles become indispensable, offering a more nuanced view by segmenting your data into four equal parts.

The Foundation of Quartiles
A quartile is a type of quantile that divides the number of data points into four more or less equal parts, or quarters. When a data set is ordered from smallest to largest, the quartiles mark specific positions:
- First Quartile (Q1) / Lower Quartile: This is the median of the lower half of the data set. 25% of the data falls below Q1.
- Second Quartile (Q2) / Median: This is the middle value of the entire data set. 50% of the data falls below Q2 (and 50% above).
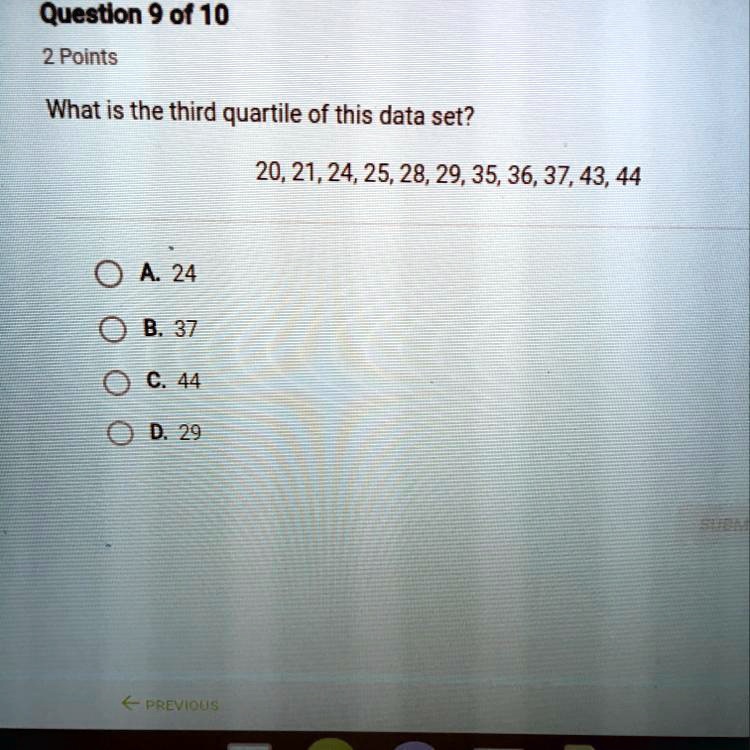
- Third Quartile (Q3) / Upper Quartile: This is the median of the upper half of the data set. 75% of the data falls below Q3 (and 25% above).
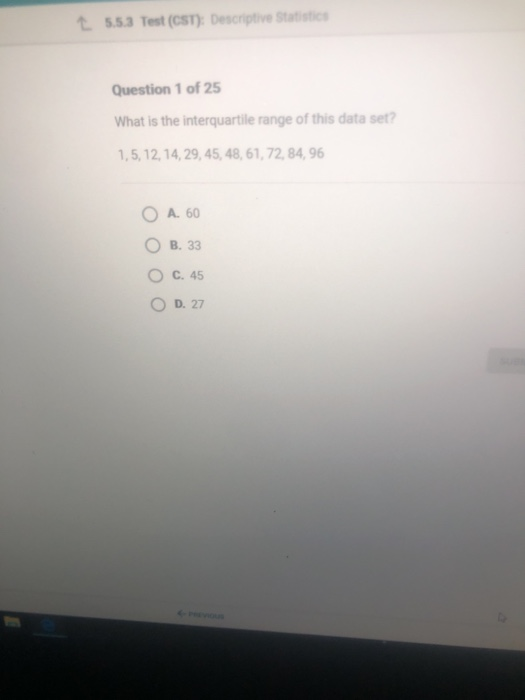
The “third quartile” specifically represents the point below which 75% of the data points lie. It reveals the upper boundary of the middle 75% of your data, providing insight into the higher values within the distribution. Coupled with the first quartile, it also defines the Interquartile Range (IQR = Q3 – Q1), a robust measure of statistical dispersion, indicating how spread out the middle 50% of the data is. This range is less sensitive to outliers than the total range, offering a clearer picture of typical variability.
Why Quartiles Matter Beyond the Average
While the average (mean) is a familiar metric, it can be misleading, especially in skewed data sets common in finance. For instance, a few extraordinarily high-income earners can drastically inflate the average income of a group, giving a false impression of overall prosperity. The median (Q2) offers a more robust central tendency measure, as it’s not affected by extreme outliers. However, the true power emerges when you consider all quartiles. By understanding Q1, Q2, and Q3, you gain insights into:
- Distribution Shape: Are your financial returns mostly clustered at the lower end, the higher end, or symmetrically around the median?
- Outlier Detection: Data points significantly above Q3 or below Q1 might be anomalies requiring further investigation – perhaps a one-time bonus, an unusual expense, or a rare market event.
- Benchmarking: How does your financial performance compare to others in the 25th percentile, the 50th percentile, or the 75th percentile? This provides context far beyond a simple average.
Applying Quartiles in Personal Finance
Personal finance is replete with data, from income streams and spending habits to investment returns and debt levels. Utilizing quartiles can transform raw numbers into actionable insights, empowering individuals to make smarter financial choices.
Understanding Income and Expense Patterns
Consider your monthly income. While you might know your average earnings, calculating the quartiles can reveal the consistency and variability of your income, especially if you have variable income sources (e.g., freelance work, commissions). Q1 might represent your leanest months, Q2 your typical earnings, and Q3 your better months. Similarly, analyzing your monthly expenses through quartiles helps categorize spending. If your Q3 for “dining out” is significantly higher than Q2, it indicates a tendency for higher spending in certain periods, pinpointing areas for potential budget adjustments. Q3 for essential expenses like groceries, when compared across months, can help identify periods of increased spending due to factors like holidays or specific events, allowing for more proactive financial planning.
Benchmarking Your Financial Health
Quartiles offer a powerful way to benchmark your personal financial health against relevant data sets. For example, if you’re comparing your savings rate, investment portfolio returns, or even your debt-to-income ratio against industry averages or peer groups, knowing where you stand in terms of quartiles provides invaluable context. Are your returns in the top 25% (above Q3), the middle 50% (between Q1 and Q3), or the bottom 25% (below Q1)? This knowledge enables realistic goal setting and helps assess whether your financial strategies are performing optimally or if adjustments are needed. For instance, a retirement savings balance at the first quartile might signal an urgent need to increase contributions, whereas a balance at the third quartile suggests you’re ahead of the curve.
Leveraging Quartiles for Investment Decisions
In the volatile world of investing, understanding data distribution is critical for assessing risk and potential returns. Quartiles provide a robust framework for evaluating investment performance and making strategic portfolio adjustments.
Analyzing Asset Returns and Volatility
When examining historical returns of a stock, bond, or mutual fund, the average return only tells part of the story. Calculating quartiles of daily, weekly, or monthly returns offers deeper insights into the investment’s behavior. Q1 represents the lower performance boundary, Q2 the typical performance, and Q3 the upper performance boundary. For instance, a high Q3 for returns indicates a strong upside potential, while a relatively low Q1 in comparison to Q2 might signal significant downside risk during poorer periods. Investors can use this to understand the probability of achieving certain return thresholds. Moreover, the Interquartile Range (IQR) of returns serves as a practical measure of volatility – a wider IQR suggests greater price fluctuations and thus higher risk.
Portfolio Performance and Risk Assessment
For a diversified investment portfolio, assessing the third quartile of its historical returns can indicate the typical ‘good performance’ range. If your portfolio consistently performs above its Q3 compared to a benchmark, it suggests superior management or a well-chosen asset allocation. Conversely, if its Q3 is modest, it might indicate conservative positioning or underperformance relative to its potential. Quartiles can also be applied to individual assets within a portfolio to identify those that consistently contribute to the upper echelons of returns versus those that lag. This granular analysis facilitates rebalancing decisions, helping investors to shed underperforming assets or capitalize on consistent strong performers, all while managing the overall risk profile based on the distribution of expected returns.
Business Finance Through the Lens of Quartiles
For businesses, financial data analysis is the backbone of operational efficiency, strategic planning, and profitability. Quartiles provide a granular view that enhances decision-making across various departments.
Sales Performance and Customer Segmentation
Understanding sales data beyond just total revenue or average transaction value is crucial. By analyzing sales data with quartiles, businesses can identify distinct performance tiers. For example, the third quartile of sales per customer might highlight the value generated by your top-performing 25% of customers, aiding in targeted marketing strategies and loyalty programs. Similarly, applying quartiles to sales volume by product category can reveal which products consistently drive the highest revenue (above Q3) versus those that are mid-tier or underperforming (below Q1), informing inventory management and product development decisions. Q3 provides a benchmark for “high performance” that can be used to set sales targets and evaluate individual sales team member productivity.
Operational Efficiency and Cost Control
Every business seeks to optimize operations and control costs. Quartiles can be powerful tools here. For example, analyzing the distribution of manufacturing costs per unit across different production batches can help identify where inefficiencies might occur. If the third quartile of costs is significantly higher than expected, it flags potential issues in the upper 25% of cost occurrences that need investigation. Similarly, examining the third quartile of employee productivity metrics (e.g., tasks completed per hour, service calls resolved) can help establish realistic performance benchmarks for top performers and identify training needs for those falling below Q1. For managing accounts payable, the third quartile of invoice processing times can highlight areas where speed and efficiency might be slipping, indicating bottlenecks or process breakdowns.
Practical Steps to Calculate and Interpret
Calculating quartiles, especially the third quartile, is straightforward with modern tools, but correct interpretation is key to unlocking their financial value.
Manual Calculation vs. Financial Tools
For small data sets, you can manually calculate quartiles:
- Order the data: Arrange all values in ascending order.
- Find the Median (Q2): This is the middle value. If there’s an even number of data points, it’s the average of the two middle values.
- Find Q1: This is the median of the data points below Q2.
- Find Q3: This is the median of the data points above Q2.
For larger and more complex financial data sets, dedicated financial tools and software are invaluable. Spreadsheet programs like Microsoft Excel or Google Sheets have built-in functions (e.g., QUARTILE.EXC or QUARTILE.INC) that automate this process. Financial analysis software, statistical packages (like R or Python with libraries such as NumPy and Pandas), and even some online financial calculators can efficiently compute quartiles, allowing you to focus on interpretation rather than calculation. These tools are particularly useful when dealing with thousands or millions of data points, as is common in market analysis or large-scale business finance.
The third quartile, therefore, is not merely a statistical figure; it’s a critical lens through which individuals and businesses can gain deeper financial insights, identify patterns, manage risks, and make strategically sound decisions in an increasingly data-driven world. By moving beyond simple averages, we unlock the full narrative held within our financial data.
aViewFromTheCave is a participant in the Amazon Services LLC Associates Program, an affiliate advertising program designed to provide a means for sites to earn advertising fees by advertising and linking to Amazon.com. Amazon, the Amazon logo, AmazonSupply, and the AmazonSupply logo are trademarks of Amazon.com, Inc. or its affiliates. As an Amazon Associate we earn affiliate commissions from qualifying purchases.