The question “what is the stock market at?” is a common refrain, asked by seasoned investors, curious onlookers, and those planning their financial futures alike. It’s a query that seeks an immediate snapshot of the global economic pulse, a quick read on the health of corporate America, and an indicator of investor sentiment. However, the answer is rarely a simple number. Instead, it’s a complex interplay of indices, economic data, corporate performance, and human psychology, all contributing to a dynamic landscape that is constantly shifting.
Understanding “where the stock market is” requires looking beyond a single day’s headlines. It demands an appreciation for the various metrics that define its current state, the underlying forces that drive its movements, and the broader context within which it operates. This article aims to demystify this critical question, providing a comprehensive overview for anyone seeking to grasp the intricate world of financial markets.
Decoding the Market’s Pulse: Key Indicators
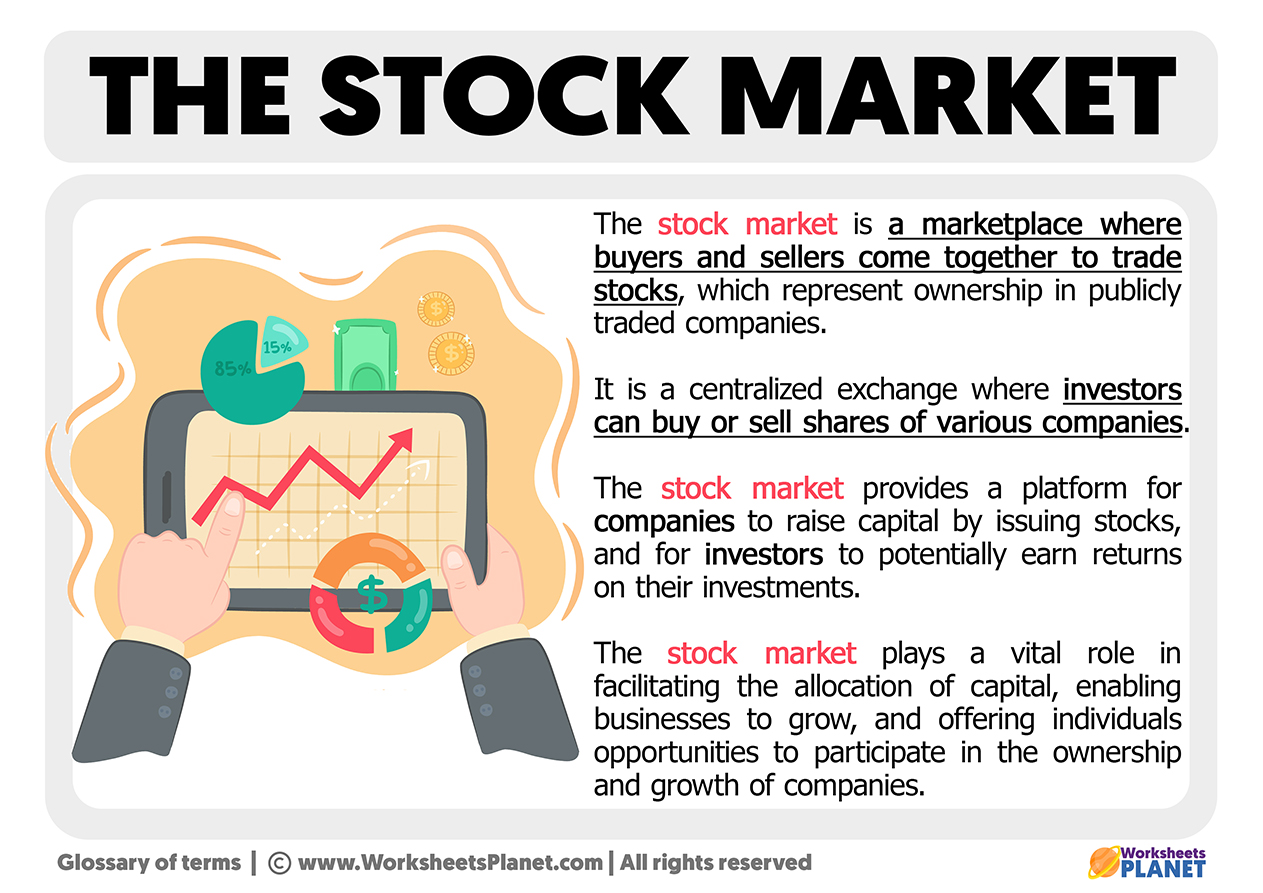
When someone asks about the stock market’s current position, they are typically referring to the performance of its most prominent indices. These indices are not the market itself but rather representative baskets of stocks designed to reflect the overall health and direction of specific segments or the market as a whole.
The Big Three: S&P 500, Dow Jones, and Nasdaq Composite
These three indices are often cited as the primary gauges of the U.S. stock market’s performance, each offering a distinct perspective:
- The S&P 500 (Standard & Poor’s 500): Widely considered the best representation of the large-cap U.S. equity market and a proxy for the overall health of the American economy. It comprises 500 of the largest publicly traded companies in the United States, weighted by market capitalization. Its movements reflect the performance of a broad cross-section of industries.
- The Dow Jones Industrial Average (DJIA): Perhaps the most famous and oldest stock market index, the Dow tracks 30 large, publicly owned companies trading on the New York Stock Exchange (NYSE) and Nasdaq. While historically significant, it’s a price-weighted index, meaning higher-priced stocks have a greater impact, and its limited number of components makes it less comprehensive than the S&P 500.
- The Nasdaq Composite: This index is heavily weighted towards technology and growth companies. It includes almost all stocks listed on the Nasdaq stock exchange, making it a key indicator for sectors like technology, biotechnology, and internet-related companies. Its performance is often seen as a bellwether for innovation and future economic growth.
Beyond the Headlines: Broader Market Metrics
While the “Big Three” dominate financial news, other indices and metrics offer deeper insights:
- Russell 2000: This index tracks the performance of 2,000 small-cap U.S. companies. Its movements can indicate the health of smaller, domestically focused businesses and often serve as an early indicator of economic shifts, as small businesses can be more sensitive to economic changes.
- Global Indices: For a broader perspective, investors often look at international indices like the FTSE 100 (UK), DAX (Germany), Nikkei 225 (Japan), and the Hang Seng Index (Hong Kong). These provide context on global economic trends and interconnectedness.
- Sectoral Performance: Beyond aggregate indices, looking at specific sectors (e.g., energy, healthcare, financials, consumer staples) can reveal underlying trends and strengths or weaknesses that might be masked by broad market averages.
Reading the Numbers: What Index Values Signify
An index’s value itself is less important than its change over time. A rise indicates a general increase in the value of the constituent stocks, suggesting investor confidence and positive economic outlooks. A fall indicates the opposite. Analysts often look at:
- Daily, Weekly, Monthly, and Annual Changes: To understand short-term volatility versus long-term trends.
- Percentage Changes: More meaningful than absolute point changes, as they contextualize the movement relative to the index’s base value.
- All-Time Highs/Lows: Significant psychological and technical levels that can influence future market behavior.
The Forces Shaping Market Performance
The stock market is a complex adaptive system, influenced by a myriad of factors ranging from robust economic data to unforeseen global events and the collective psychology of millions of participants. Understanding these drivers is crucial to interpreting “what the market is at” and anticipating its future direction.
Macroeconomic Tides: Interest Rates, Inflation, and GDP
These are the bedrock indicators that central banks and governments monitor closely, and their ripple effects are felt throughout the stock market:
- Interest Rates: Controlled by central banks (like the Federal Reserve in the U.S.), interest rates profoundly impact corporate borrowing costs, consumer spending, and the attractiveness of alternative investments (like bonds). Higher rates can make borrowing more expensive for companies, potentially dampening profits, and can make fixed-income investments more appealing, drawing money away from stocks.
- Inflation: The rate at which prices for goods and services are rising, eroding purchasing power. Persistent high inflation can squeeze corporate profit margins as input costs increase, and it often prompts central banks to raise interest rates, further impacting stocks.
- Gross Domestic Product (GDP): The total value of goods and services produced in an economy. A strong, growing GDP generally signals a healthy economy, which translates to higher corporate earnings and investor confidence, typically boosting stock prices. Conversely, a contracting GDP can signal a recession.
- Employment Data: Low unemployment rates and rising wages generally indicate a robust economy with strong consumer spending, which is positive for corporate revenues. High unemployment can signal economic weakness.
Corporate Health and Earnings Reports
At its core, the stock market reflects the aggregate performance and future expectations of the companies listed on it.
- Corporate Earnings: Quarterly and annual earnings reports are critical catalysts for stock movements. Strong earnings, particularly when they exceed analysts’ expectations, can send stock prices soaring. Weak earnings or downward revisions to future guidance can lead to sharp declines.
- Revenue Growth: Beyond just profits, sustained revenue growth indicates a company’s ability to expand its market share and innovate.
- Profit Margins: The percentage of revenue that turns into profit. Healthy and expanding margins suggest efficient operations and pricing power.
- Guidance and Outlook: Companies often provide forecasts for future earnings and revenues. These projections are vital for investors and can have a more significant impact than past performance, as the market is forward-looking.
Geopolitical Events and Global Shocks
The stock market doesn’t exist in a vacuum; it’s intricately linked to global events.
- Wars and Conflicts: Geopolitical instability can disrupt supply chains, impact commodity prices (especially oil), create uncertainty, and erode investor confidence, leading to market downturns.
- Trade Wars and Tariffs: Disputes between major economies can hurt multinational corporations, increase costs, and lead to reduced global trade, negatively impacting market performance.
- Pandemics and Natural Disasters: Events like the COVID-19 pandemic demonstrated how quickly global health crises can trigger severe economic contraction and market volatility. Similarly, large-scale natural disasters can impact specific industries and regions.
- Political Stability: Stability within a country and internationally provides a predictable environment for businesses to operate and for investors to commit capital. Political turmoil often introduces uncertainty and risk.
Investor Sentiment and Behavioral Finance
While fundamentals are crucial, the emotional and psychological aspects of investing play a significant role in short-term market movements.
- Fear and Greed: These two emotions are powerful drivers. Greed can lead to irrational exuberance and asset bubbles, while fear can trigger panic selling and market crashes, often independent of underlying economic reality.
- Market Narratives: Prevailing stories or beliefs about the economy, specific industries, or even individual stocks can drive significant buying or selling pressure.
- Herd Mentality: Investors often follow the crowd, buying when others are buying and selling when others are selling, which can amplify market trends.
- Technical Analysis: Many traders base decisions on chart patterns and market psychology, which can create self-fulfilling prophecies in the short term.
Navigating Market Dynamics: Understanding Movements and Volatility
The stock market is rarely static; it’s a dynamic entity characterized by cycles of growth and contraction, periods of calm and extreme turbulence. Grasping these dynamics is essential for any investor seeking to understand its current state and make informed decisions.
Bull vs. Bear: Identifying Market Cycles
These terms describe the overarching sentiment and direction of the market:
- Bull Market: Characterized by rising stock prices, optimism, and investor confidence. During a bull market, economic growth is typically strong, unemployment is low, and corporate profits are rising. Investors are eager to buy, expecting further gains. A common definition is a rise of 20% or more from a recent low.
- Bear Market: Defined by falling stock prices, pessimism, and investor fear. Bear markets are often associated with economic slowdowns, recessions, or significant geopolitical uncertainty. Investors are typically selling, anticipating further losses. A common definition is a decline of 20% or more from a recent high.
It’s important to remember that individual stocks or sectors can experience bull or bear markets independently of the broader market.
Corrections and Crashes: A Normal Part of the Cycle
Not all downturns signify a bear market, but they are crucial to acknowledge:
- Market Correction: A short-term decline of 10% to 20% from a recent peak. Corrections are a normal and healthy part of market cycles, often serving to “reset” valuations and cool off overheated markets. They can be triggered by minor economic concerns or simply profit-taking.
- Market Crash: A sudden, significant, and often catastrophic drop in stock prices, typically much sharper than a correction and potentially exceeding 20% in a short period. Crashes are rare but can lead to widespread panic and have profound economic consequences, often associated with major financial crises or systemic shocks.
Measuring Volatility: The VIX Index
Volatility refers to the rate at which the price of a security or index increases or decreases.
- The VIX (Volatility Index): Often called the “fear gauge,” the VIX measures the market’s expectation of future volatility based on S&P 500 option prices. A high VIX reading indicates high expected volatility (often associated with market fear and uncertainty), while a low reading suggests market complacency and stability. Monitoring the VIX can provide insights into prevailing market sentiment.
Essential Tools for Market Tracking
Staying informed is paramount. Investors utilize various tools:
- Financial News Outlets: Reputable sources like The Wall Street Journal, Bloomberg, Reuters, Financial Times, and CNBC provide real-time data, expert analysis, and breaking news.
- Brokerage Platforms: Most online brokers offer advanced charting tools, real-time quotes, news feeds, and research reports.
- Financial Data Websites: Sites like Google Finance, Yahoo Finance, and TradingView offer free access to charts, historical data, and basic analytical tools.
- Economic Calendars: These calendars list upcoming economic data releases (e.g., inflation reports, jobs data, GDP figures) that are likely to influence market movements.
Strategic Implications for Investors
For investors, the question of “what is the stock market at” is not merely academic; it directly influences portfolio decisions and long-term financial planning. Understanding the market’s current state and its drivers is fundamental to navigating its complexities successfully.
Short-Term Speculation vs. Long-Term Growth
How one interprets the market’s current position largely depends on their investment horizon:
- Short-Term Trading: For day traders or swing traders, the market’s “at” implies daily or even hourly movements. These investors focus on technical analysis, immediate news, and high-frequency data to capitalize on fleeting price fluctuations. This approach is highly risky and requires significant expertise and emotional resilience.
- Long-Term Investing: For most individuals, the “at” is viewed in the context of years or decades. Long-term investors focus on fundamental analysis, economic trends, and the growth potential of quality companies. They are less concerned with daily volatility and more interested in the market’s ability to compound wealth over time, leveraging the power of dollar-cost averaging and reinvestment.
The Power of Diversification
A critical lesson from observing market dynamics is the importance of not putting all your eggs in one basket.
- Asset Allocation: Spreading investments across different asset classes (stocks, bonds, real estate, commodities) helps mitigate risk. When one asset class underperforms, another may perform well, smoothing out portfolio returns.
- Geographic and Sectoral Diversification: Investing in companies across different countries and industries reduces exposure to specific regional economic downturns or sector-specific risks. If the U.S. market is struggling, international holdings might provide a buffer.
- Company-Specific Diversification: Within equities, owning a variety of stocks across different market capitalizations and risk profiles reduces the impact of any single company’s poor performance.
Emotional Discipline in Market Fluctuations
The market’s movements, particularly its downturns, can trigger strong emotions that often lead to poor financial decisions.
- Avoiding Panic Selling: When the market dips, the urge to sell to “stop the bleeding” can be powerful. However, selling during a downturn often locks in losses and prevents participation in the inevitable recovery.
- Resisting FOMO (Fear of Missing Out): During bull markets, the desire to jump into rapidly rising stocks can lead to investing in overvalued assets or taking on excessive risk.
- Sticking to a Plan: Having a well-defined investment strategy, aligned with personal financial goals and risk tolerance, is crucial. This plan should include guidelines for buying, selling, and rebalancing, helping investors remain objective during volatile periods.
- Understanding Risk Tolerance: Knowing how much volatility one can psychologically endure without making impulsive decisions is vital for constructing a suitable portfolio.
Utilizing Financial Tools and Expertise
Navigating the complexities of “what the stock market is at” can be challenging alone.
- Robo-Advisors: Automated platforms that build and manage diversified portfolios based on an investor’s risk tolerance and goals, often at a lower cost than traditional advisors.
- Financial Advisors: For those with more complex financial situations or who prefer personalized guidance, a qualified financial advisor can provide tailored strategies, help with goal setting, and offer emotional support during market swings.
- Educational Resources: Continuous learning through books, reputable financial websites, and courses empowers investors to make more informed decisions and understand market intricacies.
Looking Ahead: The Ever-Evolving Market Landscape
The stock market is not a static entity; it’s a living, breathing reflection of global human endeavor, innovation, and interaction. Its current “at” is but a fleeting moment in a continuous journey, shaped by past events and ever-evolving future possibilities.
The Role of Innovation and Disruptive Technologies
Technological advancements are constant drivers of market change. New industries emerge, old ones transform, and disruptive technologies create new leaders while challenging established incumbents. AI, biotechnology, renewable energy, and digital currencies are just a few examples of areas that will continue to reshape market valuations and create new investment opportunities. Staying abreast of these trends is crucial for identifying future growth sectors.
Global Interconnectedness and Its Impact
The world’s economies are more intertwined than ever before. Events in one corner of the globe can have swift and profound impacts on markets elsewhere. Geopolitical stability, international trade agreements, and the health of major economies like China, Europe, and India will continue to play a significant role in determining the overall direction of global stock markets. This interconnectedness underscores the importance of a globally diversified portfolio.
Preparing for the Future: A Prudent Approach
Given the inherent unpredictability of the stock market, a prudent long-term approach is key. This involves:
- Continuous Learning: The financial landscape is always changing, and staying informed about new trends, regulations, and economic theories is essential.
- Regular Review and Rebalancing: Periodically reviewing your investment portfolio and rebalancing it to maintain your desired asset allocation helps ensure it remains aligned with your goals and risk tolerance.
- Focus on Long-Term Goals: Despite short-term fluctuations, focusing on long-term financial objectives – retirement, education, homeownership – helps investors avoid impulsive decisions driven by market noise.
- Embracing Imperfection: No one can consistently predict the market’s short-term movements. Accepting this uncertainty and focusing on a sound, disciplined strategy for the long run is often the most effective path to wealth accumulation.
In conclusion, “what is the stock market at” is a question that opens a window into the complex and fascinating world of finance. It’s a testament to the dynamic interplay of economic fundamentals, corporate performance, global events, and human psychology. While daily headlines provide a momentary snapshot, a deeper understanding reveals a constantly evolving system, one that rewards knowledge, patience, and a well-thought-out strategy. For the informed investor, the market’s current position is not just a number, but a point on a much larger, ongoing journey of wealth creation.
aViewFromTheCave is a participant in the Amazon Services LLC Associates Program, an affiliate advertising program designed to provide a means for sites to earn advertising fees by advertising and linking to Amazon.com. Amazon, the Amazon logo, AmazonSupply, and the AmazonSupply logo are trademarks of Amazon.com, Inc. or its affiliates. As an Amazon Associate we earn affiliate commissions from qualifying purchases.