When investors ask, “What is the stock market at right now?” they are rarely looking for a specific numerical value of a single index. Instead, they are searching for a pulse—a comprehensive understanding of the financial ecosystem’s health, the trajectory of corporate earnings, and the underlying psychological state of the global investing community. To understand where the market stands today, one must look beyond the flashing green and red tickers and analyze the convergence of macroeconomic policy, sector-specific momentum, and the fundamental shifts in how value is perceived in a post-inflationary world.
The current state of the stock market is a complex tapestry of resilience and caution. After a period of historic volatility driven by global health crises and subsequent supply chain disruptions, we find ourselves in an era defined by high interest rates, the transformative potential of artificial intelligence, and a delicate balancing act performed by central banks. Understanding “where the market is” requires a breakdown of the benchmarks, the drivers, and the strategies currently dominating the financial landscape.
The Benchmarks: Measuring Where the Market Stands
To gauge the position of the stock market, we must first look at the three primary barometers that define performance for the majority of retail and institutional investors. These indices represent different slices of the economy and provide a multi-faceted view of financial health.
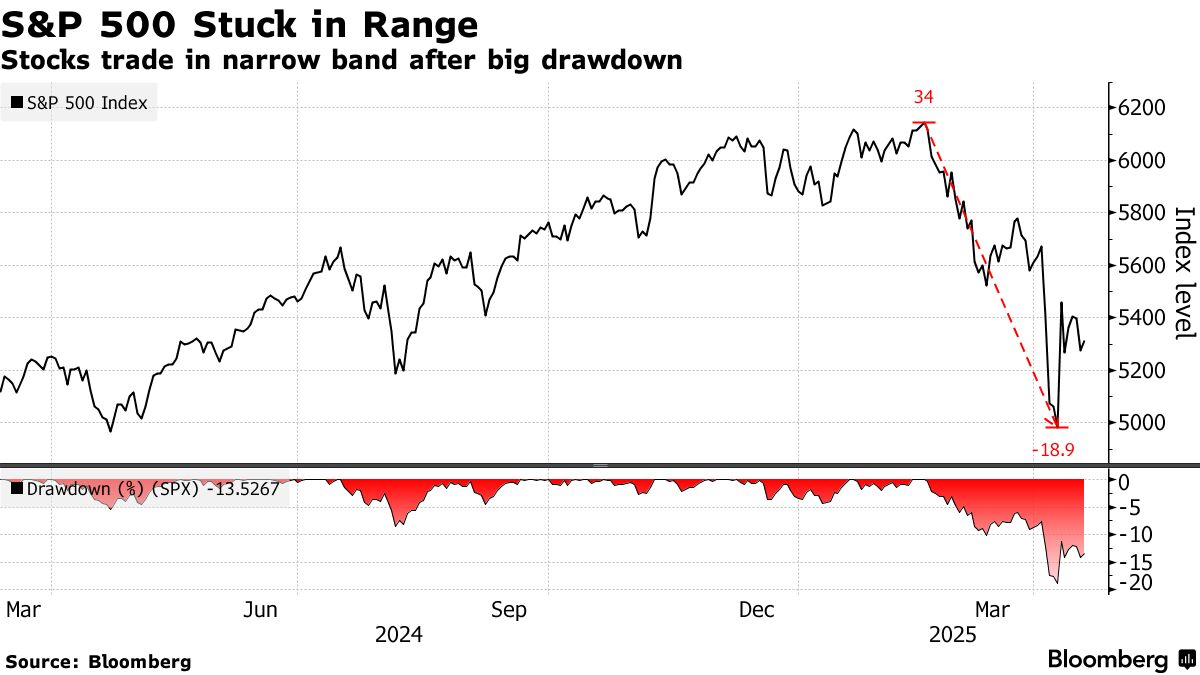
The S&P 500: The Broader Market Health
The S&P 500 is widely considered the most accurate reflection of the U.S. economy. Right now, this index is navigating a period of concentrated growth. For much of the past year, the S&P 500 has been propelled by a select group of mega-cap technology companies, often referred to as the “Magnificent Seven.” This concentration has created a “top-heavy” market where the overall index price may appear robust, even if the average mid-sized company is struggling with higher borrowing costs. When assessing where the market is through the lens of the S&P 500, analysts are currently watching for “breadth”—the degree to which smaller, non-tech companies are participating in the upward movement.
The Nasdaq Composite: Growth and Innovation Trajectories
If the S&P 500 is the heart of the market, the Nasdaq is its engine of innovation. Currently, the Nasdaq is experiencing a significant “AI premium.” Investors are pricing in massive future earnings from companies involved in semiconductors, cloud computing, and machine learning. This has pushed the Nasdaq to premium valuation levels compared to historical averages. However, this also makes the index highly sensitive to interest rate fluctuations. In the “right now” of the market, the Nasdaq serves as a high-beta indicator: when optimism is high, it leads the charge; when recession fears loom, it often sees the sharpest corrections.
The Dow Jones Industrial Average: Stability in Blue-Chip Performance
The Dow remains the bastion of the “Old Economy.” Comprising 30 blue-chip companies, it provides insight into the industrial, financial, and healthcare sectors. At present, the Dow is reflecting the steady, if unspectacular, performance of traditional value stocks. As investors rotate out of high-flying tech during periods of uncertainty, the Dow often acts as a safe harbor. Understanding its current level helps investors determine if the market is in a “risk-on” phase (favoring the Nasdaq) or a “risk-off” phase (favoring the Dow).
Macroeconomic Drivers Influicing Current Valuations
The stock market does not exist in a vacuum. Its current level is a direct reaction to the broader economic environment, dictated largely by monetary policy and the cost of capital.
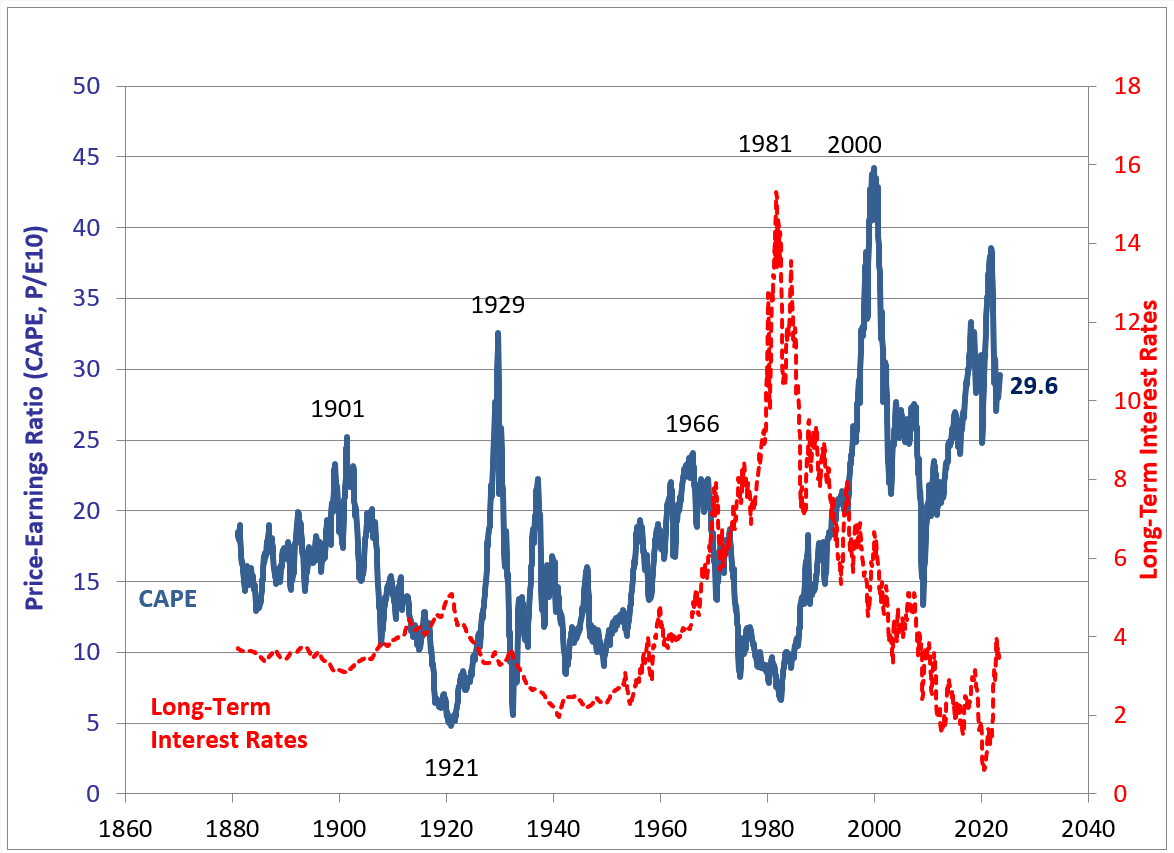
Interest Rates and the Federal Reserve’s Stance
Perhaps no single factor influences “what the market is at” more than the Federal Reserve’s federal funds rate. We are currently in a “higher for longer” environment. For over a decade, the market was fueled by near-zero interest rates, making equity investments the only viable path for growth. Now, with rates at their highest levels in decades, stocks must compete with “risk-free” returns from Treasury bonds. The current market level reflects a delicate equilibrium: investors are betting that the Fed has reached the peak of its tightening cycle and will eventually begin to cut rates, which would traditionally act as a tailwind for stock prices.
Inflationary Pressures and Consumer Spending
Inflation is the silent killer of equity valuations because it erodes corporate profit margins and reduces the purchasing power of the consumer. The market is currently in a state of “disinflationary” hope. As CPI (Consumer Price Index) data trends downward, the market tends to rally, anticipating that the squeeze on both businesses and households is easing. However, the “right now” of the market is also characterized by “sticky” inflation in the service sector, which keeps investors on edge. The resilience of the American consumer has been a surprising support pillar for the market, preventing the widely predicted recession of the previous year from materializing.
Geopolitical Stability and Supply Chain Realities
Global politics are increasingly inseparable from market performance. From energy price fluctuations driven by conflicts in the Middle East to the “de-risking” of supply chains involving East Asia, the stock market is currently pricing in a higher level of geopolitical risk than it has in previous decades. This “risk premium” means that even when earnings are good, the market may remain volatile as it reacts to headlines that could disrupt global trade or energy costs.
Sector Rotations and Market Sentiment
To understand where the market is, one must look under the hood at which sectors are winning and which are losing. The “market” is rarely a monolith; it is a shifting sea of capital moving from one industry to another.
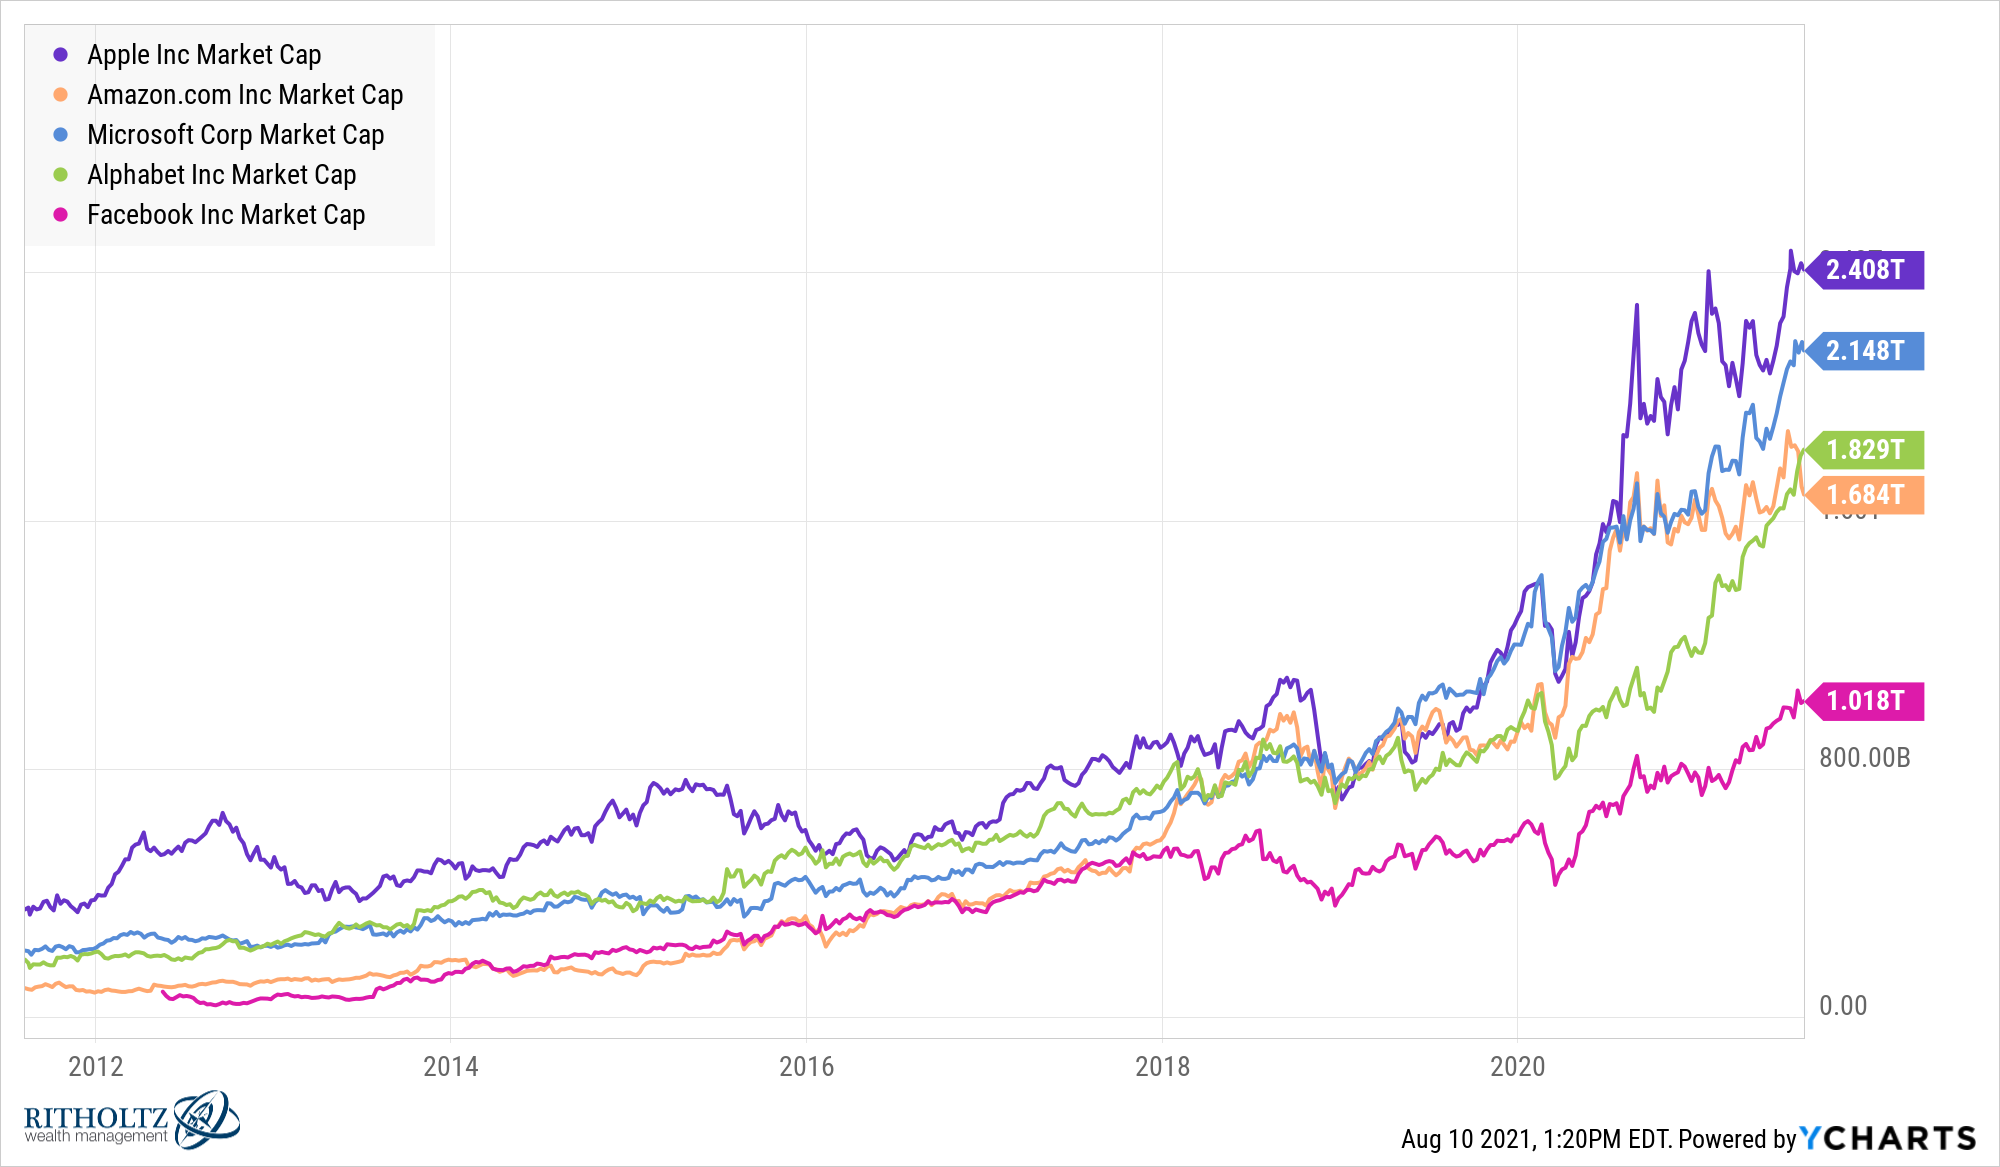
The AI Boom and Tech Dominance
We are currently witnessing a generational shift in capital allocation toward Artificial Intelligence. This isn’t just a trend; it’s a fundamental re-rating of what technology companies are worth. Companies that provide the hardware (chips) and the software (LLMs) for AI are seeing unprecedented inflows. This dominance has created a bifurcated market: there is the “AI economy” and the “rest of the economy.” Understanding the market right now requires recognizing that a significant portion of recent gains is tied to the belief that AI will exponentially increase productivity across all sectors.
Defensive vs. Cyclical Stocks
In a healthy, expanding economy, “cyclical” stocks—those in retail, travel, and manufacturing—typically lead. Currently, the market is showing a mixed signal. While tech (growth) is high, there has been a notable move toward “defensive” sectors like healthcare and utilities during periods of economic data releases. This suggests that while the market is “at” a high level, investors are hedging their bets, maintaining a foothold in companies that provide essential services regardless of the economic climate.
Fear and Greed: Analyzing the Volatility Index (VIX)
Market sentiment is often measured by the VIX, also known as the “fear gauge.” When the VIX is low, it suggests investor complacency and a steady market. When it spikes, it indicates panic. Currently, the market is exhibiting a “climb the wall of worry” mentality. Despite high interest rates and global tensions, the VIX has remained relatively suppressed, suggesting that institutional investors are cautiously optimistic. They are looking past immediate hurdles toward a future where inflation is controlled and corporate earnings continue to grow.
Strategic Positioning for Individual Investors
Knowing “what the stock market is at” is only useful if it informs how an investor manages their capital. In the current environment, the strategy has shifted from “buying everything” to “selective quality.”
Dollar-Cost Averaging in a Volatile Climate
Because the market is currently sensitive to every piece of economic data—from jobs reports to Fed minutes—timing the “perfect” entry point is nearly impossible. Professional financial advisors are increasingly advocating for dollar-cost averaging (DCA). By investing a fixed amount at regular intervals, investors can navigate the current “choppiness” of the market without the emotional stress of trying to predict the next 5% swing in either direction.
The Importance of Diversification and Rebalancing
With the market’s heavy concentration in tech, many portfolios have become unintentionally skewed. A prudent approach in the current market involves “rebalancing”—selling some of the high-performing winners to lock in gains and redistributing that capital into undervalued sectors like value stocks, international equities, or high-yield fixed income. This ensures that if the “AI bubble” were to see a correction, the investor’s entire net worth isn’t at risk.
Long-term Vision vs. Short-term Noise
Ultimately, the stock market “right now” is a snapshot in time. History shows that the market’s daily fluctuations are often noise, while its long-term trajectory is driven by innovation and human ingenuity. For the individual investor, the current state of the market—marked by high rates but strong tech growth—is an invitation to focus on fundamentals. Companies with strong balance sheets, consistent cash flow, and a competitive “moat” are the ones that will thrive, regardless of whether the S&P 500 is up or down on any given Tuesday.
In conclusion, the stock market is currently in a transformative phase. It is transitioning from an era of “easy money” to an era of “earned growth.” While the headline numbers may fluctuate based on the latest Federal Reserve meeting or inflation report, the underlying reality is a market that is resilient, tech-driven, and increasingly discerning. For those navigating this landscape, the key is not to react to where the market is today, but to position oneself for where the global economy is headed tomorrow.
aViewFromTheCave is a participant in the Amazon Services LLC Associates Program, an affiliate advertising program designed to provide a means for sites to earn advertising fees by advertising and linking to Amazon.com. Amazon, the Amazon logo, AmazonSupply, and the AmazonSupply logo are trademarks of Amazon.com, Inc. or its affiliates. As an Amazon Associate we earn affiliate commissions from qualifying purchases.