
The phrase “what is the stock market at now” is a perennial question, often posed with a mix of curiosity, concern, and strategic intent. It’s a query that speaks to the immediate pulse of the global economy, encapsulating everything from investor sentiment and corporate performance to macroeconomic shifts and geopolitical tremors. Unlike a fixed number, “what the market is at now” is a dynamic concept, reflecting an intricate dance of countless variables. For investors, business leaders, and financially-aware individuals, understanding this immediate state, and more importantly, how to interpret it, is crucial for informed decision-making. This article will dissect what it truly means to assess the stock market’s current position, exploring the key indicators, underlying forces, and practical approaches to making sense of the financial present.
Understanding the “Now”: Key Market Indicators
When one asks about the stock market’s current state, they are usually looking for a concise summary of its performance. This summary isn’t a single data point but rather an aggregation of several critical metrics that provide a snapshot of market health and direction.
The Major Market Indices: Your First Glance
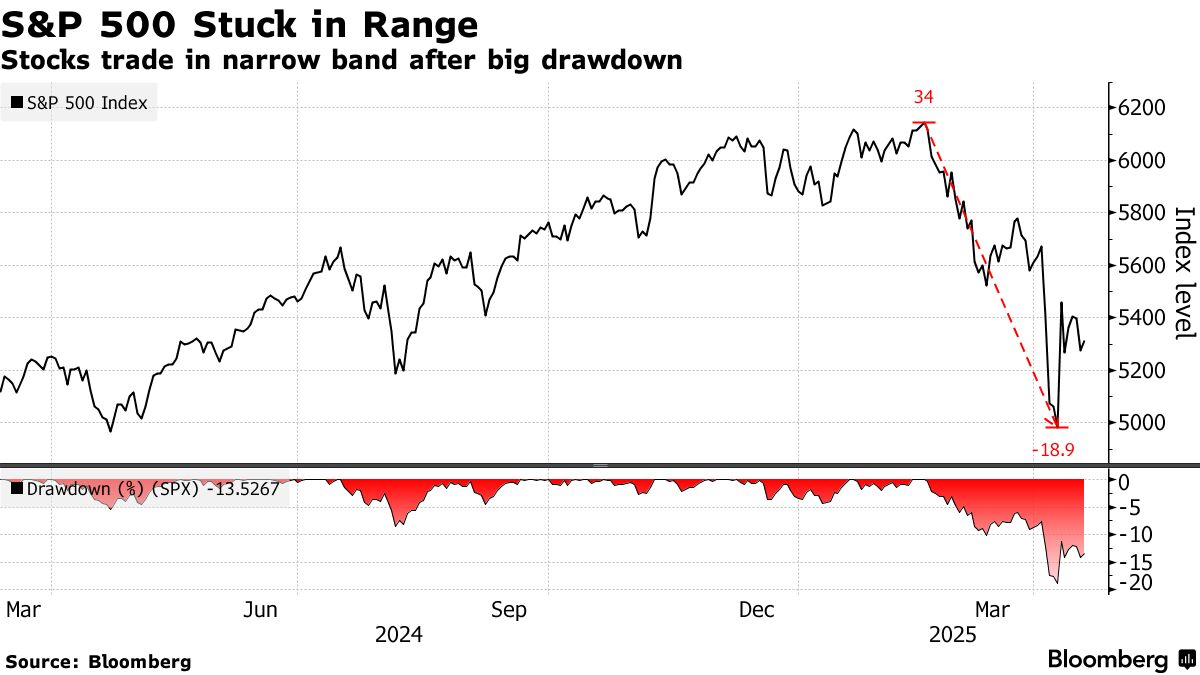
The most common way to gauge the market’s immediate performance is by looking at major stock market indices. These indices represent a basket of stocks designed to reflect the overall market or specific segments of it.
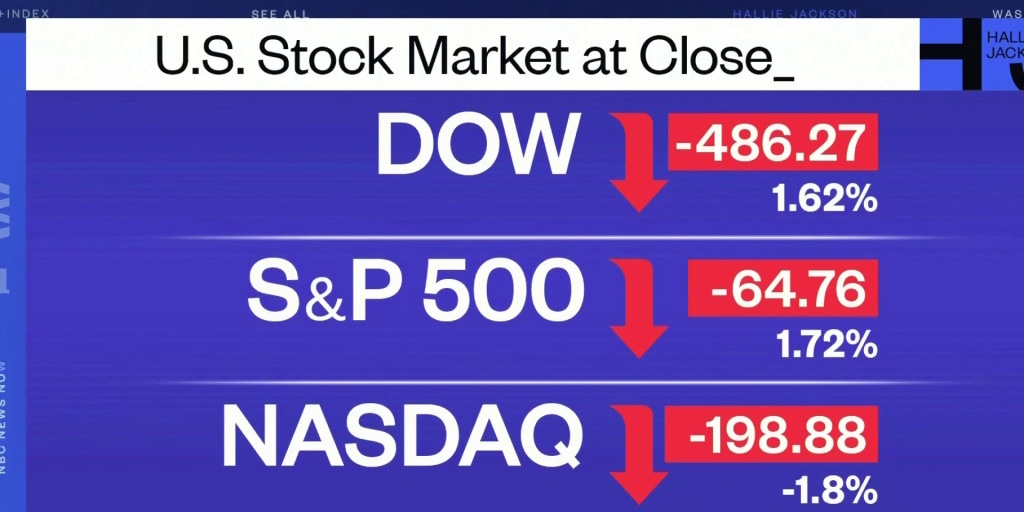
- S&P 500 (Standard & Poor’s 500): Widely considered the best gauge of large-cap U.S. equities and overall market health, it tracks the performance of 500 of the largest U.S. publicly traded companies. Its movement is often seen as a proxy for the broader economy.
- Dow Jones Industrial Average (DJIA): While less comprehensive than the S&P 500, the “Dow” tracks 30 prominent U.S. companies. Its historical significance and inclusion of industrial behemoths make it a frequently cited, though somewhat narrow, indicator.
- Nasdaq Composite: This index is heavily weighted towards technology and growth companies. Its performance offers insight into the tech sector’s health and the market’s appetite for innovation and future earnings potential.
- Russell 2000: Focusing on small-cap U.S. companies, the Russell 2000 often provides a pulse on the domestic economy, as smaller firms tend to be more sensitive to U.S. economic conditions.
Monitoring the daily, weekly, or monthly changes in these indices gives an immediate sense of whether the market is broadly trending up, down, or sideways. A significant drop in all major indices might signal widespread concern, while a robust rise could indicate optimism.
Beyond Price: Volume, Volatility, and Sentiment
While price movement is primary, other indicators add depth to our understanding of the “now.”
- Trading Volume: High trading volume during a significant price movement (up or down) suggests conviction behind that move. Low volume, conversely, might indicate a lack of strong sentiment, making a move less reliable.
- Volatility (The VIX Index): The Cboe Volatility Index (VIX), often called the “fear index,” measures the market’s expectation of future volatility based on S&P 500 options. A rising VIX typically signals increased investor uncertainty and fear, while a falling VIX suggests growing complacency or confidence.
- Market Sentiment: This is harder to quantify but crucial. It refers to the overall attitude of investors towards a particular stock or the market. Tools like CNN’s Fear & Greed Index attempt to measure this using multiple market indicators. Anecdotal evidence from financial news and expert commentary also contributes to understanding prevailing sentiment. Extreme fear can create buying opportunities, while irrational exuberance can signal an impending correction.
Macroeconomic Forces Shaping the Present Market
The stock market does not exist in a vacuum; it is deeply intertwined with the broader economy. The “now” of the stock market is a direct reflection of current macroeconomic conditions and the market’s future expectations based on these conditions.
Interest Rates and Central Bank Policy
Perhaps the most influential factor on stock market valuations is the prevailing interest rate environment, largely dictated by central banks like the U.S. Federal Reserve.
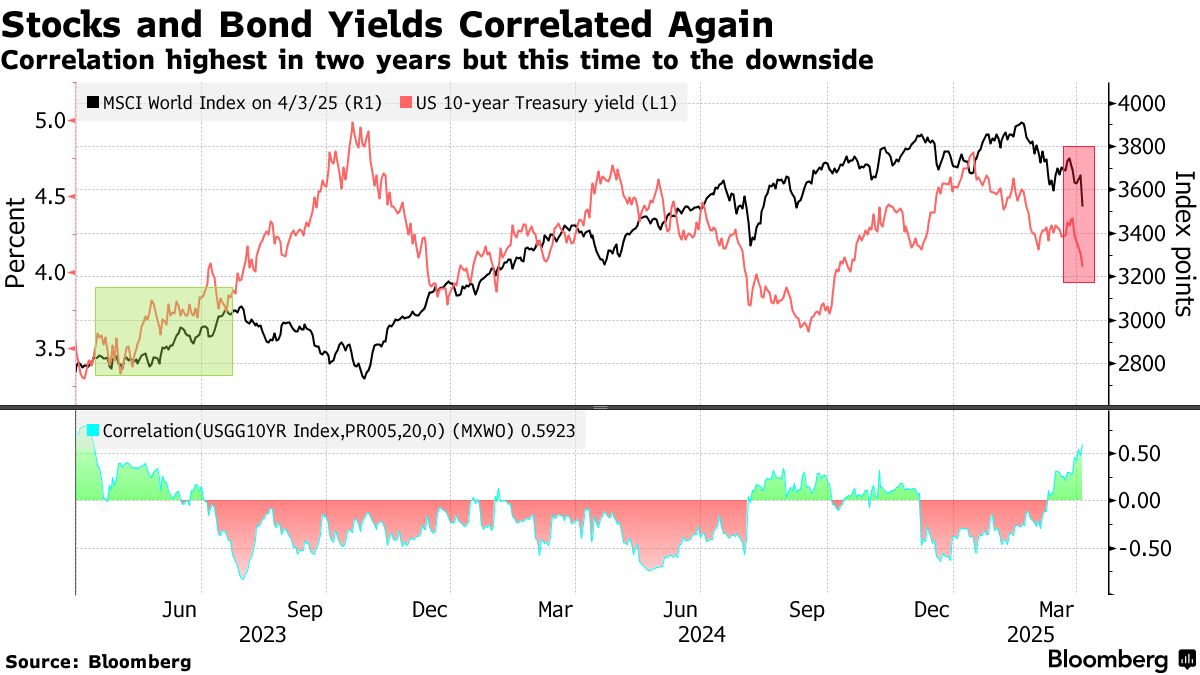
- Monetary Policy: When central banks raise interest rates, borrowing becomes more expensive for businesses and consumers, which can slow economic growth and reduce corporate profits. Higher rates also make fixed-income investments (like bonds) more attractive, drawing capital away from riskier equities. Conversely, lower interest rates stimulate borrowing, investment, and consumer spending, often boosting stock prices.
- Quantitative Easing/Tightening: Beyond rates, central banks engage in quantitative easing (buying government bonds and other securities to inject liquidity) or tightening (selling them off). These actions directly impact the money supply and asset prices, influencing the stock market’s direction. Market participants keenly watch every central bank meeting and statement for clues about future policy.
Inflation and Deflation Concerns
The purchasing power of money and the cost of goods and services profoundly impact corporate earnings and consumer behavior.
- Inflation: Moderate inflation is generally considered healthy for an economy, allowing companies to raise prices and increase revenue. However, high or runaway inflation erodes profit margins (as input costs rise), reduces consumer purchasing power, and often leads central banks to raise rates aggressively, all of which can be detrimental to stock valuations. Certain sectors, like energy or materials, might benefit from inflation, while others, like growth stocks, might suffer.
- Deflation: While seemingly positive, widespread deflation (a sustained decrease in prices) can be dangerous. It incentivizes consumers to delay purchases, expecting lower prices in the future, which can stifle demand, corporate revenues, and economic growth, leading to a downward spiral.
Economic Growth and Employment Data
The fundamental health of an economy underpins corporate profitability and investor confidence.
- Gross Domestic Product (GDP): This measures the total value of goods and services produced in an economy. Robust GDP growth typically signals a strong economy, higher corporate earnings, and a favorable environment for stocks.
- Employment Data: Key reports like the U.S. Non-Farm Payrolls report, unemployment rate, and wage growth figures offer insights into consumer health and spending capacity. A strong job market generally translates to more consumer spending, which drives corporate revenues. Conversely, rising unemployment can signal economic contraction and reduced demand.
Geopolitical Events and Global Trade
In an interconnected world, events far from Wall Street can have immediate and profound impacts.
- International Relations: Trade wars, political instability in key regions, and international conflicts can disrupt supply chains, increase commodity prices, and create uncertainty, leading to market volatility.
- Commodity Prices: Fluctuations in oil, natural gas, metals, and agricultural products affect input costs for businesses and consumer spending power, rippling through various sectors of the stock market.
- Currency Movements: A strong U.S. dollar, for instance, can make U.S. exports more expensive, potentially hurting the earnings of multinational corporations.
Sector Performance and Divergence
While major indices provide an aggregate view, a deeper understanding of “what the market is at now” requires examining how different sectors and types of companies are performing. Not all ships rise or fall with the same tide.
Identifying Leading and Lagging Sectors
At any given time, certain sectors outperform others due to shifts in economic conditions, technological advancements, or consumer preferences.
- Cyclical vs. Defensive Sectors:
- Cyclical sectors (e.g., consumer discretionary, industrials, financials) tend to perform well during economic expansions and poorly during contractions, as their revenues are closely tied to the economic cycle.
- Defensive sectors (e.g., utilities, consumer staples, healthcare) are less sensitive to economic downturns because demand for their products and services remains relatively stable. In a “risk-off” environment, money often flows into these sectors.
- Growth vs. Value Stocks:
- Growth stocks are companies expected to grow earnings and revenue at a faster rate than the broader market (often in tech, biotech). They thrive on optimism and lower interest rates.
- Value stocks are companies that appear to be undervalued by the market, trading at a discount relative to their intrinsic worth (often in financials, energy, industrials). They tend to perform better during rising interest rates or when investors seek stability.
Understanding which types of stocks or sectors are currently leading or lagging provides crucial context. For example, if defensive sectors are outperforming, it might signal investor caution and a move towards safety, even if the overall index shows moderate gains.
Impact of Industry-Specific News
Beyond broad economic trends, news pertaining to specific industries can dramatically alter their market performance. Regulatory changes, technological breakthroughs, competitive pressures, and M&A activity within a particular sector can create significant divergence from the broader market. For instance, a major regulatory ruling concerning pharmaceuticals might send healthcare stocks plummeting or soaring, irrespective of what the Dow Jones is doing. Similarly, a breakthrough in renewable energy technology could provide a significant boost to the clean energy sector.
Interpreting Market Signals for Your Portfolio
Understanding “what the market is at now” is not merely an academic exercise; it’s a vital component of prudent financial planning and investment strategy. The challenge lies in interpreting these signals effectively for your personal financial goals.
Short-Term Fluctuations vs. Long-Term Trends
One of the biggest pitfalls for individual investors is confusing short-term market noise with long-term trends. Daily or even weekly market movements are often driven by news headlines, algorithmic trading, and temporary sentiment shifts.
- Long-Term Perspective: For most investors, particularly those saving for retirement or other long-term goals, focusing on the market’s long-term trajectory is paramount. Historically, despite numerous corrections and bear markets, the stock market has trended upwards over extended periods. Trying to time the market based on “what it’s at now” day-to-day is notoriously difficult and often leads to missed opportunities.
- Market Corrections and Bear Markets: Acknowledging that periods of significant decline (corrections of 10-20% or bear markets of 20% or more) are a normal, albeit painful, part of the market cycle is crucial. These periods can be opportunities for long-term investors to buy quality assets at reduced prices, assuming their financial situation allows.
The Importance of Diversification and Risk Assessment
Understanding the market’s current state reinforces the timeless principles of investing.
- Diversification: When the market is “at now,” some sectors or asset classes may be soaring while others are struggling. A well-diversified portfolio, spread across different asset classes (stocks, bonds, real estate), sectors, geographies, and company sizes, helps mitigate risk. If one area performs poorly, others might offset those losses.
- Risk Tolerance: Your assessment of the market’s current state should always be filtered through your personal risk tolerance. A volatile market might be an exciting opportunity for an aggressive young investor but a source of anxiety for someone nearing retirement. Your asset allocation should reflect this personal comfort level with risk.
Avoiding Emotional Investing
The immediacy of “what the market is at now” can trigger strong emotions – fear during downturns, greed during rallies. Making investment decisions based on these emotions is often detrimental.
- Having a Plan: A disciplined investment strategy, ideally crafted during calm periods, provides a roadmap. Sticking to this plan, which includes regular rebalancing, helps insulate you from impulsive decisions driven by current market sentiment.
- Dollar-Cost Averaging: Investing a fixed amount regularly, regardless of market highs or lows, is a powerful strategy. When the market is “down,” your fixed investment buys more shares, effectively lowering your average cost per share over time.
Tools and Resources for Real-Time Market Insight
To stay informed about “what the stock market is at now,” reliable and timely resources are indispensable.
Financial News Outlets and Data Providers
Reputable financial media are the primary source for current market information.
- Major Financial News: Outlets like Bloomberg, Reuters, The Wall Street Journal, Financial Times, and CNBC provide real-time news, expert analysis, and market data.
- Market Data Websites: Platforms such as Yahoo Finance, Google Finance, and TradingView offer free access to stock quotes, charts, financial news, and basic analytical tools. For more in-depth data and charting, services like FactSet, Refinitiv, and Capital IQ are available to professionals.
Brokerage Platforms and Research Tools
Your own brokerage account is also a rich source of information.
- Trading Platforms: Modern brokerage platforms offer not just trading capabilities but also real-time quotes, news feeds, research reports, and analytical tools tailored to your holdings.
- Research Reports: Many brokerages provide access to analyst reports, economic commentaries, and proprietary research that can offer deeper insights into specific companies or market trends.
Economic Calendars and Earnings Reports
These structured releases provide foresight into potential market-moving events.
- Economic Calendars: These calendars list upcoming economic data releases (e.g., CPI, GDP, employment figures, central bank announcements), giving investors a heads-up on when to expect potential market volatility or shifts.
- Earnings Reports: Publicly traded companies release quarterly earnings reports detailing their financial performance. These reports, along with their forward-looking guidance, are critical drivers of individual stock prices and overall market sentiment. Following the earnings season provides a granular view of corporate health.
In conclusion, “what is the stock market at now” is a question with a multifaceted answer. It involves a continuous assessment of major indices, macroeconomic indicators, sector-specific performance, and global events. While the short-term fluctuations can be captivating, a truly insightful understanding of the market’s present state empowers investors to make decisions aligned with their long-term financial objectives, anchored in discipline and a robust understanding of fundamental drivers rather than fleeting emotions.
aViewFromTheCave is a participant in the Amazon Services LLC Associates Program, an affiliate advertising program designed to provide a means for sites to earn advertising fees by advertising and linking to Amazon.com. Amazon, the Amazon logo, AmazonSupply, and the AmazonSupply logo are trademarks of Amazon.com, Inc. or its affiliates. As an Amazon Associate we earn affiliate commissions from qualifying purchases.