
In the current digital landscape, data is often described as the new oil. However, raw data, much like crude oil, is of little use until it is refined, processed, and transformed into something actionable. In the world of technology—spanning from the algorithms that power our social media feeds to the predictive models behind autonomous vehicles—this refinement happens through the statistical process.
The statistical process is a systematic method of collecting, analyzing, interpreting, and presenting data to make informed decisions or predictions. In a tech context, this process serves as the backbone of Artificial Intelligence (AI), Machine Learning (ML), and software optimization. It is the framework that allows developers and data scientists to move from “we have information” to “we have a solution.” Understanding this process is essential for anyone navigating the tech industry, as it dictates how software learns, how digital security identifies threats, and how user experiences are personalized.
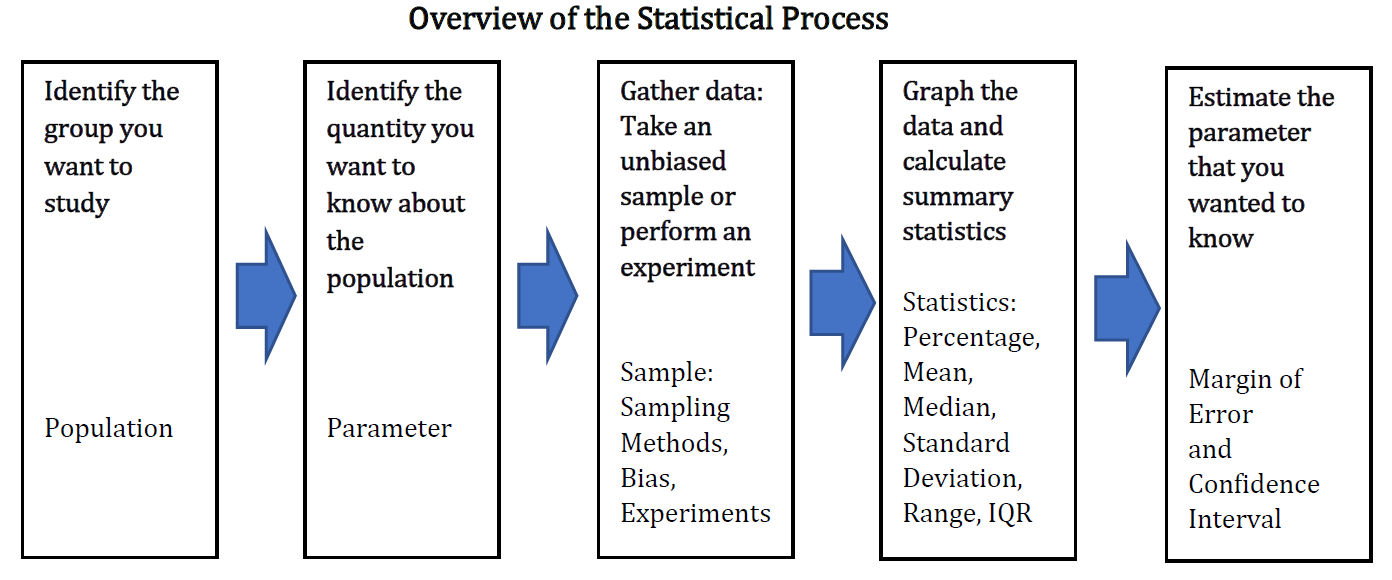
Data Acquisition and Preprocessing: The Foundation of Tech Analytics
Before a single line of code can be written for a predictive model, the statistical process begins with the rigorous phase of data acquisition and preprocessing. In technology, this is not merely about gathering numbers; it is about building a robust architecture that can handle the “Three Vs” of Big Data: Volume, Velocity, and Variety.
Defining the Problem Statement in Software Development
The statistical process in tech always begins with a clear objective. Whether a team is trying to reduce latency in a cloud application or improve the accuracy of a facial recognition tool, the problem must be translated into a statistical question. For instance, instead of saying “we want to improve the app,” a tech-focused statistical approach would ask, “What variables correlate most highly with user churn, and can we predict exit points with 95% confidence?” This initial stage ensures that the subsequent data collection is targeted and purposeful.
Automated Data Collection and Storage Architecture
Once the objective is set, tech professionals use various tools to harvest data. This could involve APIs (Application Programming Interfaces) pulling real-time user interactions, IoT (Internet of Things) sensors gathering environmental data, or web scrapers aggregating market trends. The challenge here lies in the infrastructure. High-tech environments require distributed storage solutions like Hadoop or cloud-based warehouses like AWS Redshift or Google BigQuery. The statistical process at this stage focuses on “sampling” theory—ensuring that the data collected is representative of the entire user base to avoid algorithmic bias.
Data Cleaning and Normalization for AI Training
Raw data is notoriously “noisy.” It contains missing values, duplicates, and outliers caused by system glitches or human error. In the tech niche, data cleaning (or data munging) is perhaps the most critical part of the statistical process. If “dirty” data is fed into a machine learning model, the output will be flawed—a concept known as “Garbage In, Garbage Out.” Preprocessing involves normalizing data scales, handling null values through imputation, and ensuring that categorical data is converted into numerical formats that software can interpret.
Exploratory Data Analysis (EDA) and Feature Engineering
Once the data is cleaned, the statistical process moves into a more creative and investigative phase: Exploratory Data Analysis (EDA). This is where tech professionals “listen” to the data to discover hidden patterns and relationships that will eventually inform software logic.
Identifying Patterns through Visualization Tools
In technology, EDA is rarely done by staring at spreadsheets. Instead, it involves high-powered visualization tools like Tableau, Power BI, or Python libraries such as Matplotlib and Seaborn. By plotting data points, developers can identify correlations—for example, a direct link between a specific software update and a spike in server CPU usage. These visual insights allow tech teams to form hypotheses. If the data shows a cluster of security breaches occurring at a specific timestamp, the statistical process helps identify whether this is a random fluctuation or a statistically significant trend that requires a patch.
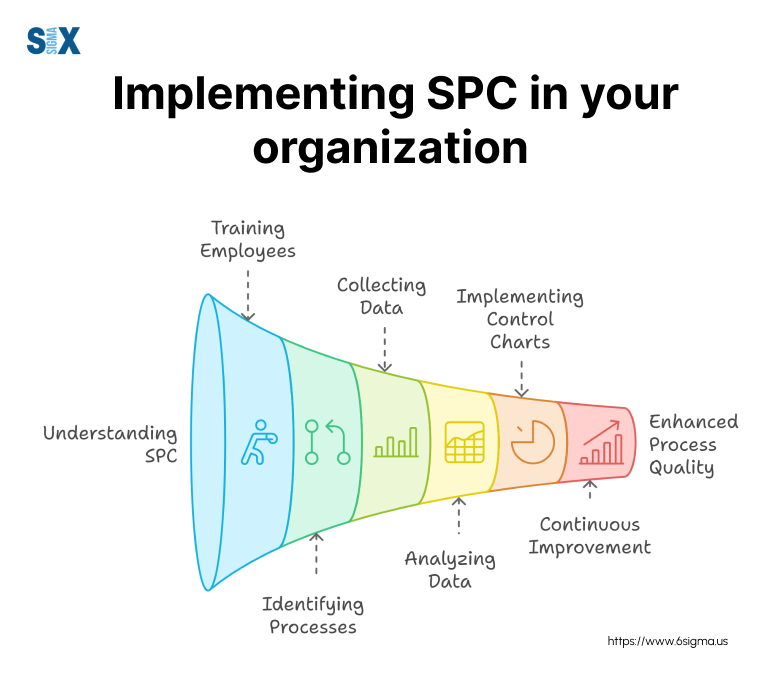
Transforming Raw Data into Technical Features
Feature engineering is where statistics meets software engineering. A “feature” is an individual measurable property or characteristic of a phenomenon being observed. In a cybersecurity context, features might include the frequency of login attempts, the geographical location of an IP address, or the time of day an access request is made. The statistical process involves selecting the most relevant features and transforming them to enhance the performance of an algorithm. This might include “dimensionality reduction”—a statistical technique that simplifies the data by removing redundant features, allowing software to run faster and more efficiently without losing critical information.
Statistical Modeling and Algorithmic Implementation
The heart of the statistical process in the tech world is the transition from observation to prediction. This is achieved through statistical modeling, where mathematical equations are used to represent the relationships between variables.
Choosing the Right Model: Regression vs. Classification
In the realm of software and AI, choosing the right statistical model is a make-or-break decision. If a developer is trying to predict a continuous value—such as the future price of a SaaS subscription based on market demand—they might use a regression model. On the other hand, if they are building a spam filter for an email app, they would use a classification model to categorize data into “spam” or “not spam.” More advanced tech applications, such as natural language processing (NLP), utilize complex neural networks, which are essentially layered statistical models designed to mimic the human brain’s neural connections.
Validating Accuracy through Cross-Validation Techniques
A model is only as good as its ability to perform on new, unseen data. In the statistical process, tech professionals use a technique called “cross-validation.” This involves splitting the available data into a “training set” and a “testing set.” The model learns from the training set, and its performance is then evaluated against the testing set. Statistical metrics such as Mean Squared Error (MSE), Precision, Recall, and the F1-Score are used to quantify the model’s accuracy. This rigorous validation ensures that the software won’t just memorize the past, but will actually be able to generalize and make accurate predictions in real-world scenarios.
Deployment and Real-Time Optimization
The final stage of the statistical process in technology is not a static conclusion, but a transition into a continuous loop of deployment and optimization. In modern tech, particularly in DevOps and MLOps, a model is never “finished.”
Integrating Statistical Models into Production Environments
After a statistical model is validated, it must be integrated into the actual software product. This involves “containerization” (using tools like Docker) to ensure the model runs consistently across different computing environments. For example, a statistical model designed to optimize battery life in a smartphone must be lightweight enough to run locally on the device’s hardware while still providing real-time adjustments based on user behavior. This integration is the bridge between theoretical statistics and functional technology.
Continuous Monitoring and A/B Testing for Performance
Once a model is live, the statistical process continues through monitoring. Tech companies use A/B testing—a classic statistical method—to compare different versions of a feature. For instance, an app developer might show Version A of a search algorithm to 50% of users and Version B to the other 50%. By applying statistical significance tests (like t-tests or p-values), they can determine which version performs better in terms of user engagement or conversion rates.
Furthermore, models in the tech world are subject to “data drift,” where the underlying data changes over time (e.g., a fraud detection model might become less effective as hackers change their tactics). The statistical process accounts for this by setting up automated triggers for retraining models when their performance metrics fall below a certain threshold.
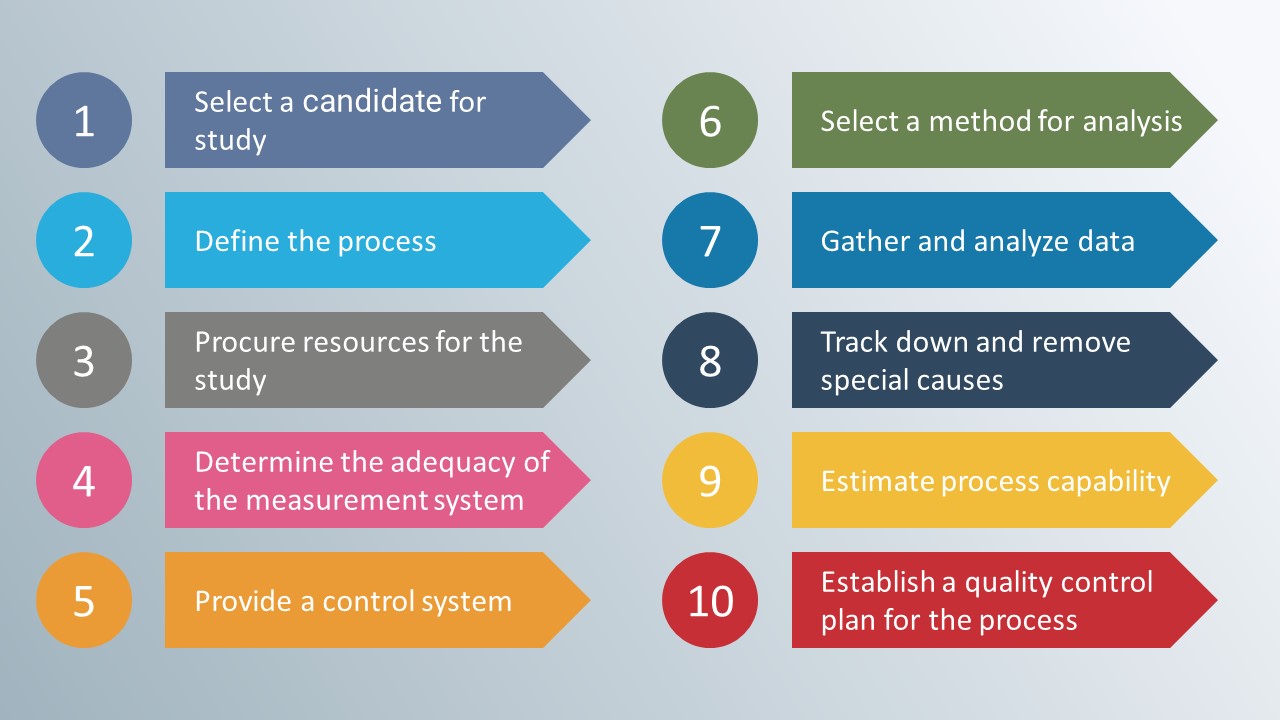
Conclusion: The Infinite Loop of Statistical Innovation
The statistical process is the silent engine of the digital age. In the tech niche, it transforms the chaos of billions of data points into the structured intelligence that defines our modern world. From the initial acquisition of data to the final deployment of high-performing algorithms, every step is governed by the principles of statistical rigor. As we move deeper into the era of AI and hyper-automation, the ability to master this process will remain the most critical skill for those building the future of technology. By viewing statistics not as a set of static formulas, but as a dynamic cycle of constant improvement, tech professionals can create software that is not only smarter and faster but also more reliable and secure.
aViewFromTheCave is a participant in the Amazon Services LLC Associates Program, an affiliate advertising program designed to provide a means for sites to earn advertising fees by advertising and linking to Amazon.com. Amazon, the Amazon logo, AmazonSupply, and the AmazonSupply logo are trademarks of Amazon.com, Inc. or its affiliates. As an Amazon Associate we earn affiliate commissions from qualifying purchases.