
In the realm of finance, numbers are far more than mere digits on a spreadsheet; they are the pulse of economic health, the indicators of growth, and the primary tools for risk assessment. When we ask, “What is the statistic?” in a financial context, we are looking for the specific metric that distills complex market behaviors or personal habits into a single, actionable insight. Understanding these statistics is the difference between making emotional decisions and executing a calculated strategy. Whether you are managing a household budget, overseeing a corporate department, or navigating the volatility of the stock market, the ability to identify and interpret the correct statistic is the ultimate competitive advantage.

The Fundamental Statistics of Personal Finance
Before one can conquer the global markets, one must first master the statistics of the self. Personal finance is often viewed through the lens of income, but income is a deceptive figure. Without the context of outflow and debt obligations, a high salary can mask a crumbling financial foundation.
The Debt-to-Income Ratio (DTI)
The Debt-to-Income ratio is perhaps the most critical statistic for anyone seeking to leverage credit or purchase property. Calculated by dividing total monthly debt payments by gross monthly income, this percentage tells lenders exactly how much “breathing room” a borrower has. In the banking world, a DTI of 36% or lower is generally considered healthy. When this statistic climbs higher, it signals that an individual is “over-leveraged,” meaning a slight dip in income could lead to a default. Mastering your DTI involves more than just paying bills; it requires a strategic approach to debt amortization and income diversification.
The Personal Savings Rate
While many focus on the total amount in their bank accounts, the more vital statistic is the personal savings rate. This is the percentage of disposable income that remains after all expenses are paid. In a consumer-driven economy, the savings rate is often the first casualty of lifestyle inflation. A high savings rate—ideally 20% or more—serves as a primary engine for wealth creation through the power of compounding. It is the “fuel” that powers future investments. Without a consistent and tracked savings rate, even a millionaire can find themselves cash-poor.
Net Worth: The Ultimate Scorecard
Net worth is the “master statistic” of personal finance. It is the simple sum of all assets minus all liabilities. Unlike monthly cash flow, which can fluctuate based on seasonal spending, net worth provides a long-term trajectory of wealth. It accounts for home equity, retirement accounts, and liquid cash, while subtracting mortgages, student loans, and credit card balances. Tracking the growth of net worth over decades is the most accurate way to measure whether a financial plan is actually working.
Decoding Investment Metrics: Beyond the Bottom Line
Moving from personal management to active investing requires a more sophisticated set of statistics. The “headline” return—how much a stock went up in a year—is often the least useful piece of information because it ignores the variables of time and risk.
Compound Annual Growth Rate (CAGR)
The Compound Annual Growth Rate (CAGR) is the statistic used to describe the rate at which an investment would have grown if it had grown at a steady rate on a compounded basis. Most investments are volatile; they go up 20% one year and down 10% the next. CAGR smooths out this volatility to provide a single, annual figure that represents the geometric progression of the investment. This allows investors to compare the performance of vastly different asset classes—such as real estate versus small-cap stocks—over identical time horizons.
Risk-Adjusted Returns and the Sharpe Ratio
A high return is meaningless if it was achieved by taking catastrophic risks. This is where the Sharpe Ratio comes in. This statistic measures the performance of an investment compared to a risk-free asset, after adjusting for its risk. It tells an investor whether their “alpha” (excess return) is a result of smart decision-making or simply because they took on too much volatility. A higher Sharpe Ratio indicates a better risk-adjusted return. In professional fund management, this is the statistic that separates the lucky amateurs from the disciplined professionals.
The Price-to-Earnings (P/E) Ratio
For equity investors, the P/E ratio is the standard statistic for valuation. It compares a company’s current share price to its per-share earnings. A high P/E might suggest that a stock is overvalued, or it might indicate that investors expect high growth rates in the future. Conversely, a low P/E could signal a value opportunity or a company in terminal decline. Context is king here; comparing the P/E of a tech startup to that of a utility company is an exercise in futility. The statistic must be viewed within its industry benchmark to be truly insightful.
The Business Engine: Vital Statistics for Corporate Health
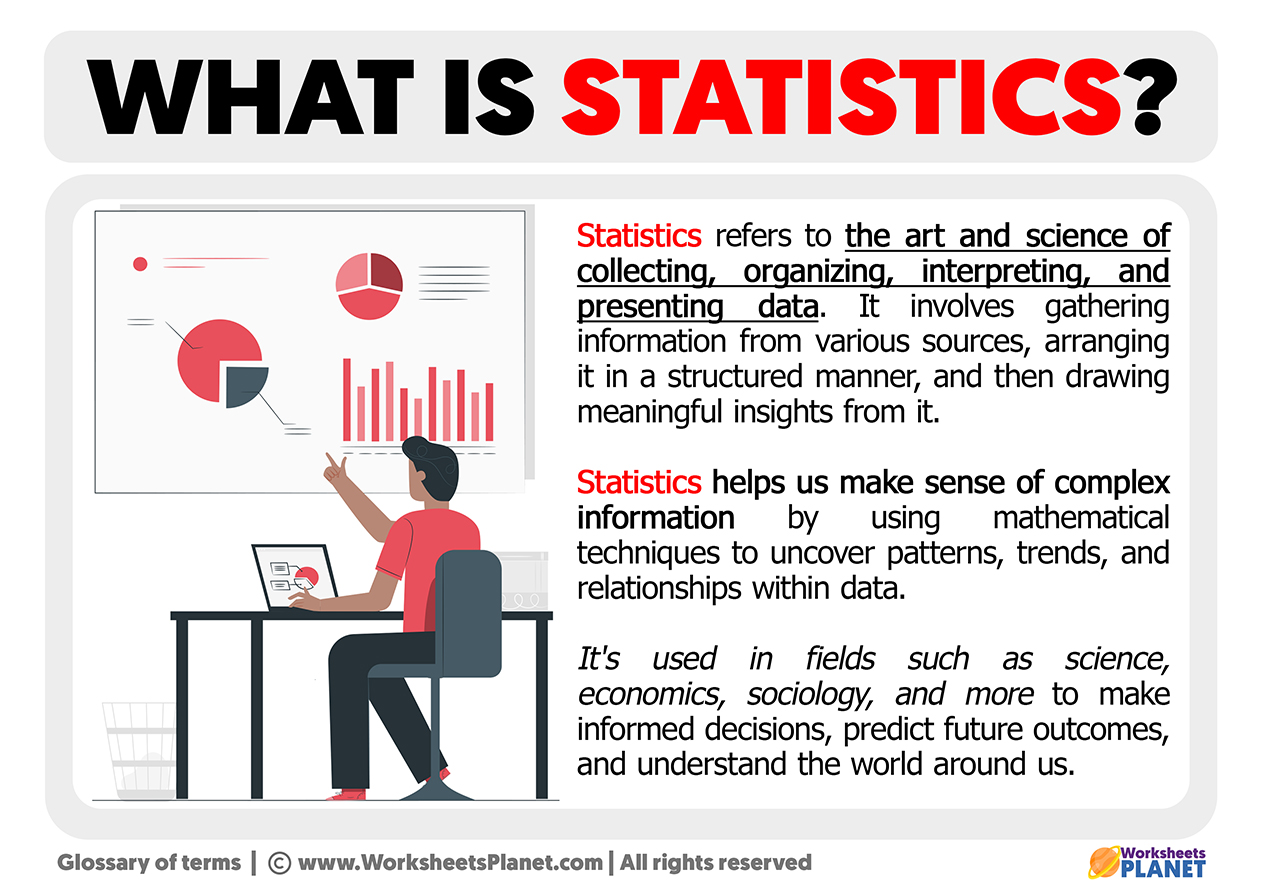
In the corporate world, statistics are used to drive efficiency and ensure longevity. For business owners and managers, the “What is the statistic?” question usually points toward liquidity and profitability metrics that indicate whether the business model is sustainable.
Gross, Operating, and Net Profit Margins
Profit is not a single number; it is a series of layers.
- Gross Margin reveals the efficiency of production by subtracting the cost of goods sold from revenue.
- Operating Margin accounts for the overhead, such as rent, marketing, and payroll.
- Net Profit Margin is the “bottom line”—what remains after taxes and interest.
By analyzing these three statistics in tandem, a business can pinpoint exactly where its money is leaking. A company with high gross margins but low net margins has an administrative bloat problem, whereas low gross margins suggest that the core product is too expensive to produce or priced too low.
Customer Acquisition Cost (CAC) vs. Lifetime Value (LTV)
In the modern digital economy, the ratio between Customer Acquisition Cost (CAC) and Customer Lifetime Value (LTV) is the definitive statistic for scalability. CAC is the total cost of sales and marketing efforts required to acquire a single customer. LTV is the total revenue a business can expect from a single customer account throughout the business relationship. If the LTV is not significantly higher than the CAC (usually a 3:1 ratio), the business is effectively buying its growth at a loss—a strategy that is only sustainable with massive venture capital infusions.
Operating Cash Flow and the Burn Rate
“Profit is an opinion; cash is a fact.” This old accounting adage highlights why operating cash flow is a more vital statistic than net income for many businesses. Cash flow tracks the actual movement of money in and out of the business. For startups, the “Burn Rate” is the statistic that determines the “runway”—the amount of time the company has before it runs out of money. Understanding the burn rate allows leadership to make timely decisions regarding fundraising or pivoting the business model before a liquidity crisis occurs.
The Statistics of Retirement and Long-Term Wealth
As we look toward the end of a career, the nature of the statistics we track changes from accumulation metrics to distribution metrics. The goal shifts from growing the pile to ensuring the pile lasts as long as the person.
The 4% Rule and Safe Withdrawal Rates
Originating from the Trinity Study, the 4% Rule is a statistic used to determine how much a retiree can withdraw from their portfolio each year without running out of money. While the rule has been debated in low-interest-rate environments, it remains the benchmark for retirement planning. It assumes a balanced portfolio of stocks and bonds and suggests that withdrawing 4% in the first year, and adjusting for inflation thereafter, provides a high probability of the portfolio lasting 30 years.
Inflation and Purchasing Power
Perhaps the most overlooked statistic in long-term finance is the Consumer Price Index (CPI), which measures inflation. Inflation is the “silent tax” that erodes purchasing power. If your investment portfolio returns 7% but inflation is at 5%, your “real” rate of return is only 2%. Financial success is not about the nominal number of dollars you have, but about what those dollars can buy. Strategic investors always look at “real” statistics rather than “nominal” ones to ensure their wealth is actually growing in terms of utility.
The Expense Ratio
For the passive investor using index funds or ETFs, the expense ratio is the statistic that matters most. This is the annual fee charged by the fund, expressed as a percentage of assets. While 0.5% or 1% might seem small, over a 40-year investing horizon, these fees can eat up nearly a third of a portfolio’s potential value due to lost compounding. Minimizing this statistic is one of the few guaranteed ways to increase net returns.

Leveraging Financial Statistics for Strategic Decision Making
Data without direction is noise. To truly answer the question, “What is the statistic?” one must understand the objective. In finance, there is no one-size-fits-all metric. A day trader needs to know the “Relative Strength Index” (RSI), while a retiree needs to know their “Safe Withdrawal Rate.”
The mastery of financial statistics requires a dual approach: technical calculation and contextual interpretation. You must know how to arrive at the number, but more importantly, you must know what the number is trying to tell you about the world. Statistics are the maps of the financial landscape. They don’t tell you where to go, but they show you where the pitfalls are, where the terrain is smooth, and how far you have left to travel. By focusing on the right metrics—DTI for stability, CAGR for growth, and LTV for business scalability—individuals and organizations can move past the guesswork and build a future founded on mathematical reality.
aViewFromTheCave is a participant in the Amazon Services LLC Associates Program, an affiliate advertising program designed to provide a means for sites to earn advertising fees by advertising and linking to Amazon.com. Amazon, the Amazon logo, AmazonSupply, and the AmazonSupply logo are trademarks of Amazon.com, Inc. or its affiliates. As an Amazon Associate we earn affiliate commissions from qualifying purchases.