
For many investors, “What is the S&P 500 doing today?” is the first question asked when opening a laptop or checking a financial app. The Standard & Poor’s 500 Index is more than just a list of numbers; it is the primary barometer for the health of the U.S. stock market and, by extension, a significant portion of the global economy. Comprising 500 of the largest publicly traded companies in the United States, it represents approximately 80% of the total market capitalization of the U.S. equity market.
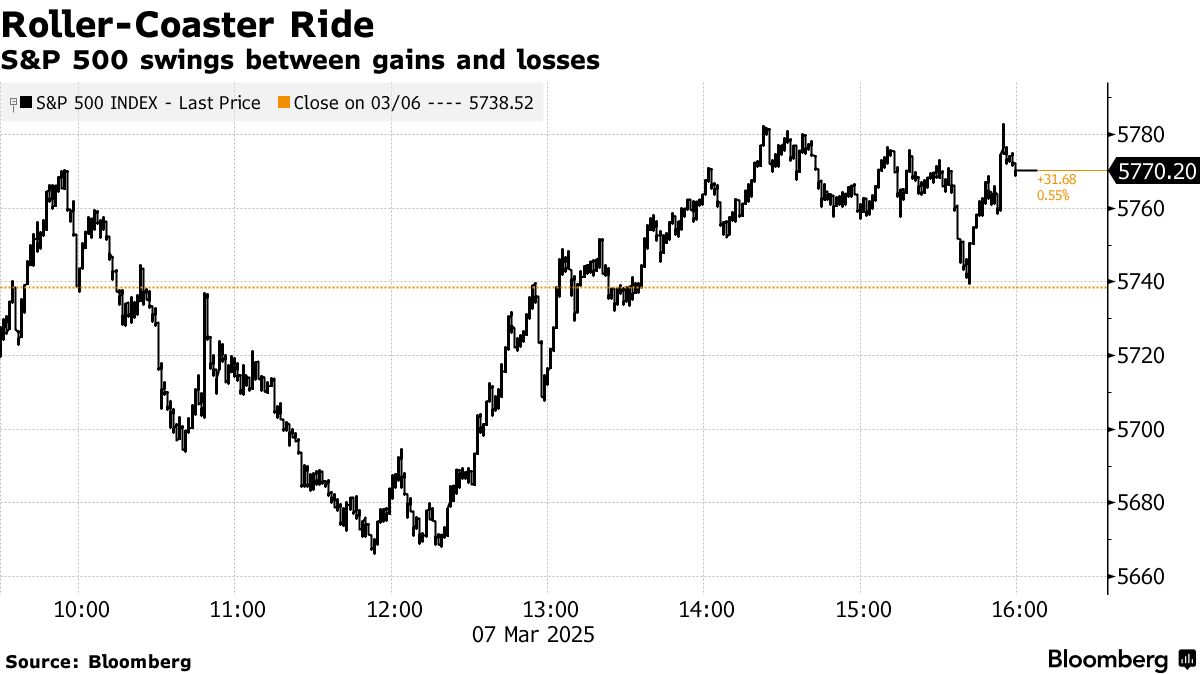
Understanding what the index is doing today requires looking beyond the green or red percentages. It involves a deep dive into macroeconomic shifts, corporate earnings, and investor psychology. Whether the index is hitting a new all-time high or retracing during a period of volatility, the movements offer a wealth of information for the disciplined investor.
1. Decoding Daily Fluctuations: What Drives the S&P 500?
The daily movement of the S&P 500 is a constant tug-of-war between buyers and sellers, fueled by a continuous stream of information. While long-term growth is driven by earnings, short-term price action is often a reflection of how the market processes new data.
Corporate Earnings and Guidance
At its core, the S&P 500 is a collection of businesses. Therefore, the most significant driver of daily movement is “Earnings Season.” When major components—such as those in the technology or healthcare sectors—report quarterly results that exceed analyst expectations, the index tends to climb. Conversely, if companies provide “weak guidance” (projecting lower future profits), investors often sell off shares, dragging the index down.
Geopolitical Events and Sentiment
The market hates uncertainty. Geopolitical tensions, trade disputes, or unexpected shifts in international relations can trigger immediate volatility. Today’s market is hyper-connected; a supply chain disruption in Asia or a policy change in Europe can influence the stock prices of U.S. multinationals instantly. This “headline risk” often causes the S&P 500 to swing as traders attempt to price in potential future risks.
Technical Indicators and Trading Volume
Many institutional investors and algorithmic trading bots use technical analysis to make decisions. Key levels, such as the 50-day or 200-day moving averages, act as psychological barriers. If the S&P 500 “breaks through” a resistance level, it can trigger a wave of buying. If it falls below a support level, it may trigger automated sell orders, accelerating a downward trend.
2. The Influence of the “Magnificent Seven” and Sector Weighting
The S&P 500 is a market-capitalization-weighted index. This means that the larger a company’s total market value, the more influence it has on the index’s daily performance. In recent years, this has led to a high concentration of power within a few massive entities.
The Dominance of Mega-Cap Tech
The so-called “Magnificent Seven”—Apple, Microsoft, Alphabet (Google), Amazon, Nvidia, Meta, and Tesla—now account for a disproportionate share of the S&P 500’s total weight. Consequently, what the S&P 500 is doing today is often a reflection of what these seven companies are doing. If Nvidia surges on AI demand, it can pull the entire index into the green, even if hundreds of smaller companies in the index are declining.
Sector Rotation and Defensive Plays
Investors often move money between sectors depending on the economic climate. This is known as “sector rotation.” When the economy is booming, investors flock to Consumer Discretionary and Technology stocks. However, on days when the S&P 500 is struggling, you might see “defensive” sectors like Utilities, Consumer Staples, and Healthcare performing better. These companies provide essential services that people need regardless of the economy, offering a “safe haven” during intraday volatility.
Energy and Financials: The Old Guard
While tech dominates the headlines, the Energy and Financial sectors remain vital. Fluctuations in crude oil prices can move energy giants like ExxonMobil, while changes in the “yield curve” (the difference between short-term and long-term interest rates) directly impact the profitability of big banks like JPMorgan Chase. Understanding these sector dynamics helps investors realize that the S&P 500 is not a monolith, but a diverse ecosystem.

3. Macroeconomic Indicators: The Role of the Federal Reserve
To understand what the S&P 500 is doing today, one must look at the “macro” environment, specifically the actions of the Federal Reserve (the Fed). Monetary policy is perhaps the single most influential factor in modern equity markets.
Interest Rates and the Discount Rate
The Fed’s primary tool for managing the economy is the federal funds rate. When the Fed raises interest rates to combat inflation, it becomes more expensive for companies to borrow money and expand. Furthermore, higher rates make the “discount rate” used to value future cash flows higher, which typically lowers the present value of stocks—especially growth stocks. On days when the Fed signals a “hawkish” stance (inclined to raise rates), the S&P 500 often reacts negatively.
Inflation (CPI) and Labor Market Data
The S&P 500 is highly sensitive to the Consumer Price Index (CPI) and employment reports. High inflation erodes consumer purchasing power and increases input costs for businesses. Conversely, a cooling labor market might signal a recession, but it could also signal to the Fed that it’s time to stop raising rates. The market’s reaction to this data depends on the prevailing “narrative”—sometimes bad economic news is seen as “good news” for the stock market if it means lower interest rates are coming.
The Strength of the U.S. Dollar
Since many S&P 500 companies are global entities, they generate a significant portion of their revenue in foreign currencies. When the U.S. Dollar is exceptionally strong, those foreign earnings are worth less when converted back into dollars. This can create a “headwind” for corporate earnings, weighing down the index even if the domestic business environment is healthy.
4. Investment Strategies for a Volatile S&P 500
Knowing what the S&P 500 is doing today is only useful if you have a strategy to act on that information—or, in many cases, a strategy to resist the urge to react impulsively.
Dollar-Cost Averaging (DCA)
For the long-term investor, the daily “noise” of the S&P 500 is secondary to a consistent contribution plan. Dollar-cost averaging involves investing a fixed amount of money at regular intervals, regardless of whether the index is up or down. This strategy ensures that you buy more shares when prices are low and fewer when prices are high, effectively lowering your average cost per share over time.
The Role of Diversification and Rebalancing
While the S&P 500 is diversified across 500 companies, it is still 100% equities. Investors often balance their S&P 500 index funds with bonds, international stocks, or real estate. On days when the S&P 500 is down significantly, a diversified portfolio helps cushion the blow. Periodic rebalancing—selling some of your “winners” to buy more of your “losers”—ensures that your risk profile remains consistent with your long-term goals.
Managing Emotional Responses to Market Swings
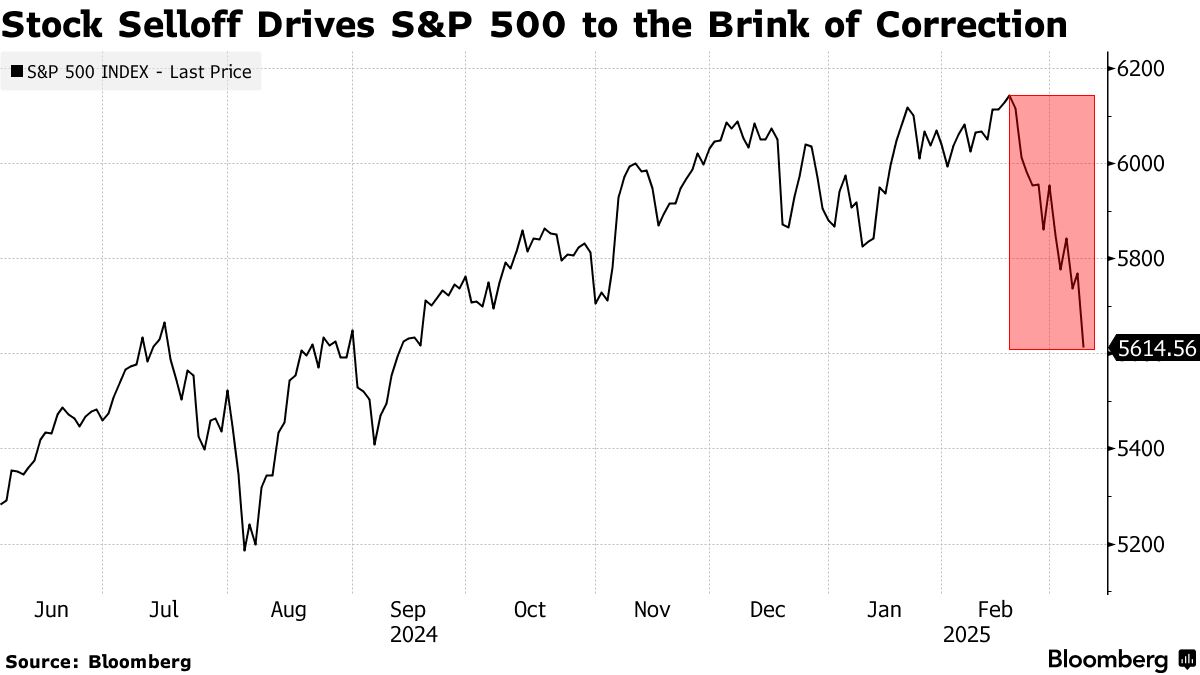
The biggest threat to an investor’s portfolio is often their own psychology. Market volatility can trigger the “fight or flight” response, leading people to sell at the bottom of a dip out of fear. Understanding that the S&P 500 has historically recovered from every single correction and bear market is crucial. Professional investors focus on “time in the market” rather than “timing the market.”
5. The Long View: Why Today’s Price is Only Part of the Story
When you ask what the S&P 500 is doing today, it’s important to remember that a single day is just one data point in a century-long chart. The index is designed to evolve; as companies fail or shrink, they are removed and replaced by the next generation of industry leaders.
Historical Performance and Compounding
Historically, the S&P 500 has provided an average annual return of approximately 10% before inflation. While there are years where the index is down 20% and others where it is up 30%, the long-term trajectory has been upward. This growth is driven by human innovation, increasing productivity, and the compounding of corporate profits. For an investor with a 20-year horizon, today’s 1% drop is a minor blip.
The Index as a Reflection of Innovation
The S&P 500 of today looks very different from the index of 1970 or even 2000. It has shifted from being dominated by industrials and oil companies to being dominated by technology and information services. By tracking the S&P 500, you are essentially betting on the continued ability of the largest U.S. corporations to innovate and adapt to changing global demands.
Conclusion: Staying Informed Without Obsessing
Monitoring what the S&P 500 is doing today provides valuable insights into the current economic climate and helps you understand the forces at play in the financial world. However, the most successful investors are those who use this information to stay informed, rather than to make frantic changes to their financial plans. By understanding the drivers of the market—from Fed policy to sector weightings—you can navigate daily volatility with a sense of perspective and confidence in your long-term financial future.
aViewFromTheCave is a participant in the Amazon Services LLC Associates Program, an affiliate advertising program designed to provide a means for sites to earn advertising fees by advertising and linking to Amazon.com. Amazon, the Amazon logo, AmazonSupply, and the AmazonSupply logo are trademarks of Amazon.com, Inc. or its affiliates. As an Amazon Associate we earn affiliate commissions from qualifying purchases.