
When investors and financial professionals ask, “What is the S&P at today?” they are rarely just looking for a four-digit number. They are seeking a snapshot of the health of the American economy, the sentiment of global investors, and the projected trajectory of corporate profitability. The Standard & Poor’s 500 Index, or the S&P 500, serves as the definitive benchmark for the U.S. equity market, tracking the performance of 500 of the largest companies listed on stock exchanges in the United States.
To understand where the S&P 500 stands today, one must look beyond the ticker symbol and delve into the macroeconomic forces, sectoral shifts, and investor psychology that drive its daily fluctuations. Whether the index is hitting record highs or retracing during a period of volatility, its position “today” is a culmination of complex financial variables that dictate the wealth of millions of retirement accounts and institutional portfolios.

The Mechanics of the Index: More Than Just a Simple Average
To grasp why the S&P 500 moves the way it does, it is essential to understand its internal architecture. Unlike the Dow Jones Industrial Average, which is price-weighted, the S&P 500 is a float-adjusted market-capitalization-weighted index. This means that companies with the highest market valuations have a disproportionately larger impact on the index’s daily movement.
Market Capitalization Weighting and the “Top-Heavy” Reality
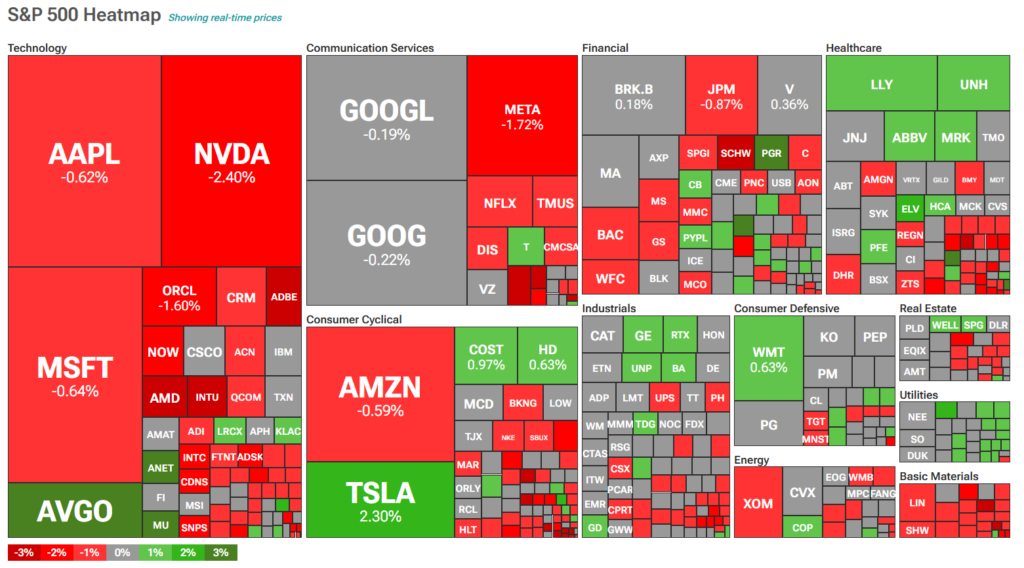
In the current financial landscape, the S&P 500 is increasingly influenced by a handful of mega-cap technology firms. When you check the index “today,” you are essentially seeing the collective performance of giants like Apple, Microsoft, Amazon, and Nvidia. Because these companies carry such significant weight, the S&P 500 can sometimes rise even if the majority of the 500 companies are trading lower, provided the “Magnificent Seven” or other tech leaders are seeing gains. This concentration of power has led to debates among financial analysts regarding the index’s diversification and whether it truly reflects the breadth of the U.S. economy or merely the dominance of the tech sector.
The 11 GICS Sectors
While technology often steals the spotlight, the S&P 500 is categorized into 11 Global Industry Classification Standard (GICS) sectors. These include Healthcare, Financials, Consumer Discretionary, Communication Services, Industrials, Consumer Staples, Energy, Real Estate, Materials, and Utilities. Tracking where the S&P is “at” requires looking at which sectors are leading or lagging. For instance, in a high-interest-rate environment, Utilities and Real Estate might struggle due to higher borrowing costs, whereas Financials might benefit from improved net interest margins. Understanding this sectoral rotation is key for any investor looking to interpret the daily movements of the broader market.
The Macroeconomic Drivers Influencing Today’s Price Action
The value of the S&P 500 on any given day is a reaction to news, data, and expectations. Markets are forward-looking mechanisms; they do not just trade on what is happening now, but on what investors believe will happen six to twelve months into the future.
Federal Reserve Policy and Interest Rates
Perhaps no single entity influences the S&P 500 more than the Federal Reserve. The “discount rate”—the interest rate at which future corporate earnings are valued—is determined by the Fed’s monetary policy. When the Fed adopts a “hawkish” stance (raising rates to combat inflation), the S&P 500 often faces downward pressure because higher rates make borrowing more expensive for companies and make fixed-income assets like bonds more attractive relative to stocks. Conversely, a “dovish” Fed that is cutting or pausing rates tends to act as a tailwind for the index. Today’s market level is often a direct reflection of the latest “Fed speak” or the most recent Consumer Price Index (CPI) report.
Corporate Earnings and Valuation Ratios
At its core, the S&P 500 is a collection of businesses. Therefore, its value is ultimately tied to corporate earnings. During “earnings season,” the index’s daily position is highly sensitive to the quarterly reports of its constituent companies. Investors look specifically at the Price-to-Earnings (P/E) ratio to determine if the index is overvalued or undervalued relative to historical norms. If the S&P 500 is trading at a high multiple during a period of stagnant earnings growth, it may be perceived as “expensive,” leading to a potential correction. Today’s investors must weigh the current price against the actual profitability of the American corporate machine.
Geopolitical Stability and Global Sentiment
The U.S. stock market does not exist in a vacuum. Geopolitical tensions in Europe, Asia, or the Middle East can trigger a “risk-off” sentiment, causing investors to pull capital out of equities and move into “safe-haven” assets like gold or U.S. Treasuries. Supply chain disruptions, international trade agreements, and global energy prices also feed into the daily valuation of the S&P 500. When checking the index today, one must consider the broader global context and how international instability might be affecting domestic large-cap companies with significant overseas operations.
How to Interpret “Today’s” Performance for Long-Term Wealth
For the individual investor, seeing the S&P 500 in the red or the green on a specific day can elicit emotional responses. However, professional money management requires a more detached, analytical approach to daily price action.
Volatility vs. Long-Term Secular Trends
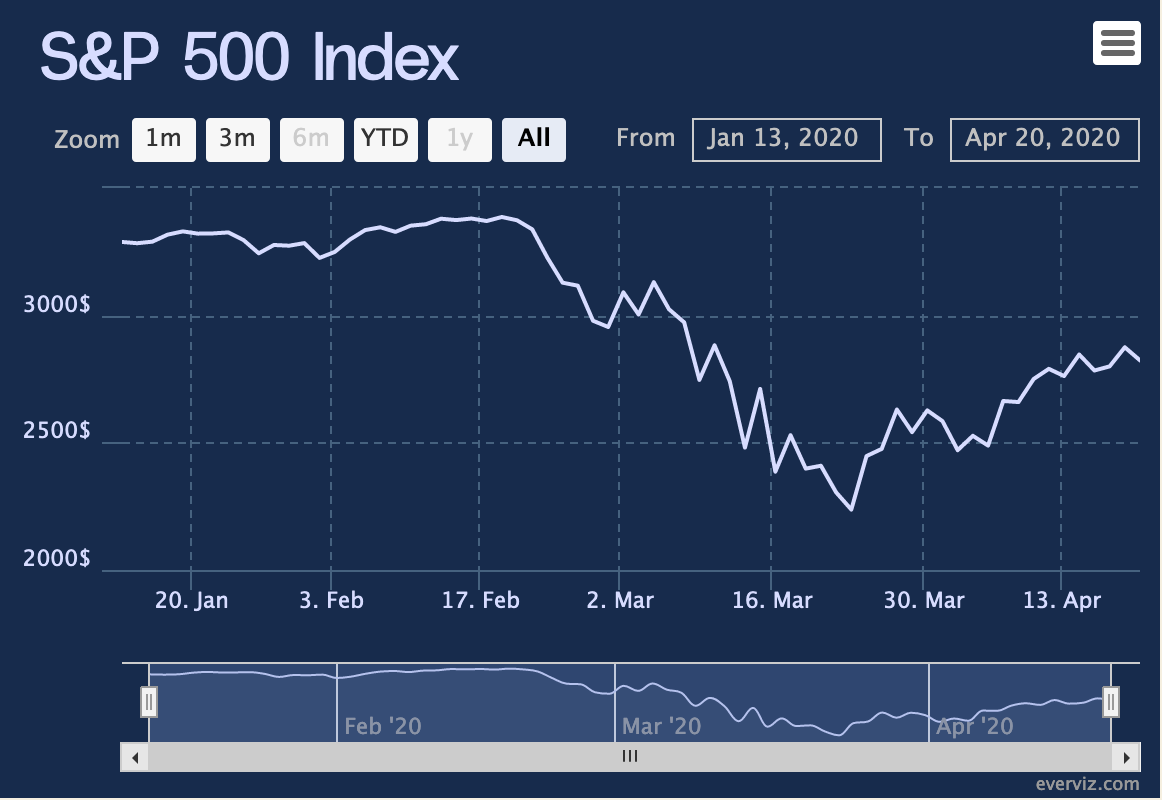
Daily fluctuations in the S&P 500 are often “noise”—short-term movements driven by high-frequency trading algorithms, retail speculation, or reactionary news cycles. It is vital to distinguish between this daily volatility and the long-term secular trend. Historically, despite numerous bear markets and economic recessions, the S&P 500 has averaged an annual return of approximately 10% over several decades. When the S&P is “down” today, it may represent a buying opportunity for the disciplined investor, rather than a reason for panic.
The Role of Index Funds and ETFs
The rise of passive investing has changed how the S&P 500 behaves. Most individual investors access the S&P 500 through Exchange-Traded Funds (ETFs) like SPY, VOO, or IVV. Because these funds must buy and sell shares of the underlying 500 companies to match the index, they create a self-reinforcing loop of liquidity. Understanding that a large portion of the S&P’s “value today” is tied to these massive inflows of passive capital is crucial for understanding modern market dynamics. It also highlights the importance of cost-effective investing; by utilizing low-fee index funds, investors can capture the full performance of the S&P 500 without the risks associated with individual stock picking.
Strategic Asset Allocation in a Fluctuating Market
Knowing where the S&P 500 is “at today” should inform, but not dictate, your broader financial strategy. Successful wealth management involves building a portfolio that can withstand the index’s inevitable downturns while participating in its growth.
Diversification and Risk Management
While the S&P 500 is a diversified index of 500 companies, it is still 100% equity-based. To manage risk, investors often balance their S&P 500 exposure with other asset classes, such as international stocks, small-cap companies, bonds, and real estate. If the S&P 500 is reaching all-time highs today, it might be a signal for an investor to “rebalance”—selling some equity gains to buy into underperforming asset classes, thereby maintaining their desired risk profile.
The Power of Dollar-Cost Averaging (DCA)
One of the most effective ways to handle the uncertainty of where the market will be “at today” is through Dollar-Cost Averaging. By investing a fixed amount of money at regular intervals, regardless of the S&P 500’s price, you naturally buy more shares when prices are low and fewer shares when prices are high. This strategy removes the psychological burden of trying to “time the market” and ensures that you are consistently building your position in the world’s most influential companies.
Conclusion: The S&P 500 as a Mirror of Progress
In summary, “what the S&P is at today” is more than just a metric; it is a real-time reflection of human ingenuity, economic policy, and global sentiment. While the number will change by the time you finish reading this article, the underlying principles governing its movement remain constant. It is an index driven by corporate earnings, influenced by central bank decisions, and fueled by the collective belief in the continued growth of the American economy.
For the savvy investor, the goal is not to obsess over the daily decimal points, but to understand the fundamental drivers of value. By focusing on long-term trends, maintaining a diversified portfolio, and understanding the sectoral and macroeconomic forces at play, you can look at the S&P 500 today not with anxiety, but with the insight needed to build lasting financial security. The index is not just a tracker of stocks; it is the scorecard of global capitalism, and today’s score is simply one chapter in a much larger story of wealth creation.
aViewFromTheCave is a participant in the Amazon Services LLC Associates Program, an affiliate advertising program designed to provide a means for sites to earn advertising fees by advertising and linking to Amazon.com. Amazon, the Amazon logo, AmazonSupply, and the AmazonSupply logo are trademarks of Amazon.com, Inc. or its affiliates. As an Amazon Associate we earn affiliate commissions from qualifying purchases.