
Understanding where the S&P 500 is trading at any given moment is more than just observing a number; it’s a window into the current pulse of the U.S. economy and the collective sentiment of investors worldwide. This benchmark index provides a critical snapshot for individuals managing their personal finances, making investment decisions, or simply trying to gauge the financial health of the nation.
Decoding the S&P 500: A Bellwether of the Market
The S&P 500 is arguably the most widely recognized and followed stock market index globally. Its movements are meticulously tracked by everyone from seasoned institutional investors to individual savers with their first brokerage account.
Understanding the S&P 500 Index
The S&P 500, officially known as the Standard & Poor’s 500, is a stock market index that represents the performance of 500 of the largest publicly traded companies in the United States. These aren’t just any 500 companies; they are selected by a committee based on criteria such as market size, liquidity, and sector representation, making the index a robust and diversified proxy for the overall U.S. equity market.
Unlike the Dow Jones Industrial Average, which is price-weighted and composed of only 30 stocks, the S&P 500 is market-capitalization weighted. This means that companies with larger market values (share price multiplied by the number of shares outstanding) have a greater impact on the index’s movement. For instance, a small percentage change in the stock price of a tech giant like Apple or Microsoft will influence the S&P 500 significantly more than the same percentage change in a smaller company within the index.
The companies included span across all major sectors of the economy, including technology, healthcare, financials, consumer discretionary, industrials, and more. This broad representation ensures that the S&P 500 offers a comprehensive view of how various industries are performing and, by extension, how the broader U.S. economy is faring. Investors often view the S&P 500 as a reliable indicator of large-cap U.S. stock performance and overall market health.
How the Index Value is Calculated
The S&P 500’s value is not a sum of individual stock prices but rather a proprietary calculation that aggregates the market capitalizations of its constituent companies. When you see the S&P 500 trading at, say, 5,200 points, it doesn’t mean that the average stock price is $5,200. Instead, it’s an index number relative to a base period.
The index’s value changes continuously throughout the trading day as the prices of the 500 underlying stocks fluctuate. A rise in the index means that the aggregated market capitalization of these companies has increased, reflecting positive investor sentiment and/or improved corporate outlooks. Conversely, a drop indicates a decrease in their combined market value. For investors, it’s not just the absolute number that matters, but more importantly, the change in that number—both in points and percentage terms—over specific periods (daily, weekly, monthly, year-to-date). Percentage changes provide a standardized way to compare performance across different timeframes and against other assets.
Factors Influencing the S&P 500’s Daily Movements
The S&P 500 is a dynamic entity, its trading level subject to a myriad of forces that can shift its trajectory in an instant. Understanding these influences is crucial for interpreting market signals and making informed financial decisions.
Economic Indicators and Corporate Earnings
At the heart of the S&P 500’s movements are fundamental economic data and corporate performance. Macroeconomic indicators provide a broad overview of the economy’s health. For example, robust GDP growth often signals a strong economy, potentially leading to higher corporate profits and, subsequently, a rising S&P 500. Conversely, surging inflation, as measured by the Consumer Price Index (CPI) or Producer Price Index (PPI), can erode purchasing power and corporate margins, potentially leading to market apprehension. Employment reports, particularly the monthly non-farm payrolls, offer insights into labor market strength, which directly impacts consumer spending—a major driver of economic activity.
Perhaps one of the most immediate catalysts for market movement is corporate earnings. Quarterly earnings reports from the S&P 500 companies, along with their forward-looking guidance, can dramatically sway investor sentiment. Strong earnings, exceeding analyst expectations, typically boost stock prices and, due to market-cap weighting, the broader index. Conversely, missed earnings or a pessimistic outlook can trigger sell-offs. Interest rate decisions by central banks, especially the U.S. Federal Reserve, also play a pivotal role. Higher interest rates increase borrowing costs for businesses and consumers, potentially slowing economic growth and making bonds more attractive relative to stocks.
Geopolitical Events and Global Markets
The S&P 500 does not exist in a vacuum. Geopolitical events, ranging from international trade disputes and political instability in key regions to military conflicts, can introduce significant uncertainty into global markets. Such events often lead to increased market volatility as investors reassess risks and potential impacts on supply chains, commodity prices, and consumer confidence. For example, a major conflict or a shift in trade policy between economic superpowers can disrupt global commerce, affecting the profitability of multinational corporations within the S&P 500 and subsequently influencing the index’s trading level. Moreover, major economic developments in other large economies, such as China or the Eurozone, can have ripple effects, impacting the earnings of U.S. companies with significant international operations.
Market Sentiment and Technical Factors
Beyond tangible economic data and geopolitical headlines, market sentiment—the overall psychological mood of investors—is a powerful force. Fear and greed are primal emotions that can drive herd behavior, leading to rapid market shifts. Periods of high optimism can fuel speculative buying, pushing the S&P 500 higher than fundamental valuations might suggest, while widespread fear can trigger panics and sharp declines.
Technical factors also play a role, particularly for short-term traders. These include trading volume, which indicates the level of market activity; volatility, measured by indices like the VIX (often called the “fear gauge”); and various charting patterns. The increasing prevalence of algorithmic trading, where computer programs execute trades based on pre-defined rules, can amplify market movements, contributing to rapid price changes that might not be directly tied to new fundamental information.
Why the S&P 500’s Trading Level Matters to Investors
For individual and institutional investors alike, the S&P 500’s trading level is more than just a data point; it’s a critical tool for assessing portfolio performance, gauging economic health, and informing investment strategies.
Benchmarking Investment Performance
One of the primary reasons investors track the S&P 500 is its utility as a benchmark. Mutual funds, exchange-traded funds (ETFs), and individual investment portfolios are frequently measured against the S&P 500 to determine their relative success. If your portfolio gained 8% in a year while the S&P 500 gained 12%, you underperformed the market. Conversely, a 15% gain against the S&P 500’s 12% indicates outperformance. This comparison is vital for evaluating the effectiveness of investment managers or individual stock-picking strategies. For those who invest in S&P 500 index funds or ETFs, the index’s performance directly reflects their returns, minus minimal fees.
Gauging Economic Health and Future Outlook
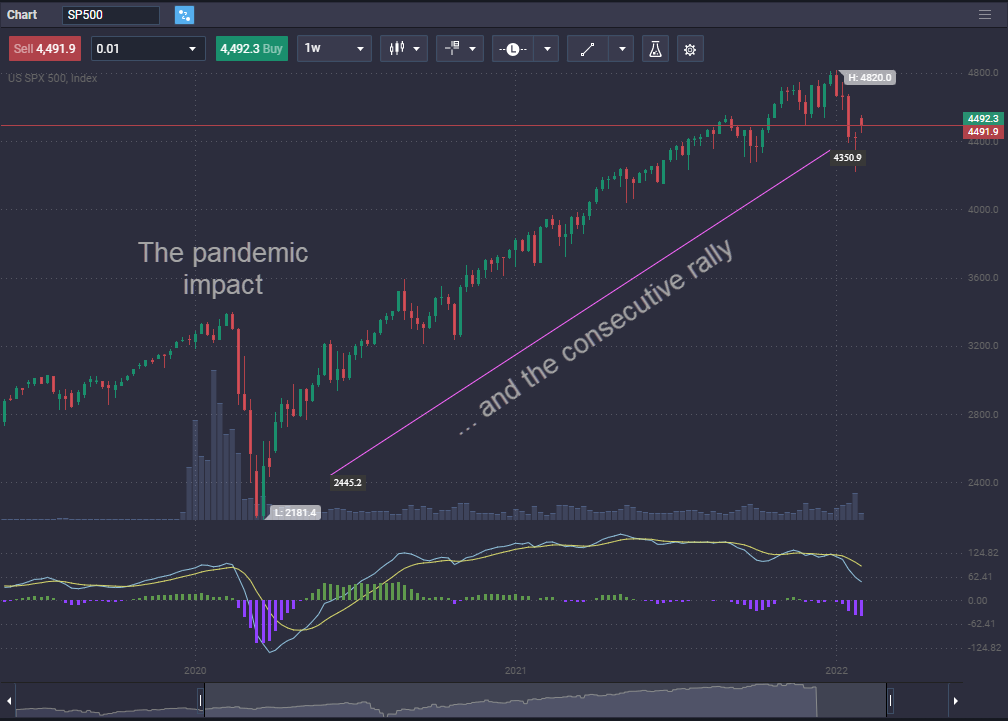
The S&P 500 is often considered a leading economic indicator. A sustained rise in the index typically signals investor optimism about future corporate profits and broader economic growth. Conversely, a significant and prolonged downturn can suggest concerns about an impending economic slowdown or recession. While the market is not always perfectly predictive, its collective wisdom, reflecting millions of investor decisions, often offers a forward-looking perspective on where the economy might be headed. For example, if the S&P 500 begins to decline several months before official recession data emerges, it often reflects investors pricing in future economic weakness.
Impact on Personal Investment Strategies
For long-term investors focused on wealth accumulation, daily fluctuations in the S&P 500 are often viewed as “noise.” Their strategy typically involves consistent contributions and diversification, with an understanding that market downturns are a normal part of the investing cycle and often present buying opportunities. Strategies like dollar-cost averaging, where a fixed amount is invested regularly regardless of market levels, are designed to smooth out the impact of volatility over time.
For more active investors or traders, however, the S&P 500’s daily and even hourly movements are critical. They might use technical analysis to identify trends, support, and resistance levels, making tactical decisions based on these shorter-term price actions. Regardless of the strategy, understanding the index’s current level and its historical context helps investors make informed decisions about rebalancing portfolios, allocating new capital, or adjusting risk exposure.
Accessing Real-Time S&P 500 Data and Its Interpretation
In today’s interconnected financial world, obtaining real-time S&P 500 data is easier than ever. However, simply knowing the number is only the first step; understanding how to interpret it correctly is where true financial literacy lies.
Reliable Sources for Market Data
For accurate and up-to-the-minute S&P 500 data, numerous reliable sources are available. Major financial news websites such as Bloomberg, Reuters, The Wall Street Journal, and CNBC consistently provide real-time updates, often with accompanying analysis. Most online brokerage platforms (e.g., Fidelity, Charles Schwab, E*TRADE) offer their clients robust market data terminals, charting tools, and news feeds. Furthermore, specialized financial data providers like Yahoo Finance, Google Finance, and TradingView offer comprehensive insights, including historical data, advanced charts, and related market indicators, often free of charge.
When checking the S&P 500’s current trading level, always look for the most recent data point, often accompanied by the daily change in both points and percentage. Be aware that some free sources might have a slight delay (e.g., 15-20 minutes) compared to professional terminals, though for most individual investors, this delay is negligible for understanding broader market movements.
Beyond the Headline Number: Key Metrics to Observe
While the headline S&P 500 number is important, several other metrics provide a more nuanced understanding of market conditions:
- Daily Change (Points and Percentage): This tells you how much the index has moved up or down since the previous close. The percentage change is particularly useful for comparing daily performance.
- Year-to-Date (YTD) Performance: This metric provides context, showing how the index has performed since the beginning of the current calendar year. It helps gauge longer-term trends beyond a single day’s movement.
- 52-Week High/Low: These figures indicate the highest and lowest points the S&P 500 has reached over the past year. They offer a perspective on the index’s current position within its recent trading range, signaling whether it’s near a peak, a trough, or somewhere in between.
- Volume: High trading volume during a significant price movement (up or down) suggests conviction behind that move, while low volume might indicate less market consensus.
- Volatility Index (VIX): Often called the “fear gauge,” the VIX measures the market’s expectation of future volatility based on S&P 500 options prices. A rising VIX typically signals increasing investor uncertainty and fear, often correlating with declining markets.
- Sector Performance: Observing which sectors within the S&P 500 are leading or lagging can provide insights into underlying economic trends. For instance, a strong performance in technology or consumer discretionary might indicate economic growth and consumer confidence.
Interpreting Market Movements with Prudence
The most crucial aspect of tracking the S&P 500 is to interpret its movements with prudence and avoid emotional reactions. Daily market swings are common and often do not reflect fundamental long-term changes. Reacting impulsively to every dip or surge can lead to poor financial decisions. Instead, focus on longer-term trends and contextualize daily movements within broader economic narratives.
Distinguish between short-term “noise” driven by news headlines or technical trading and long-term trends influenced by fundamental economic shifts and corporate earnings. For substantial investment decisions, it’s always advisable to consult with a qualified financial advisor who can provide personalized guidance tailored to your specific financial goals, risk tolerance, and time horizon.
Long-Term Perspective: The S&P 500 as a Growth Engine
While daily fluctuations capture headlines, the true power of the S&P 500 lies in its historical long-term growth and its role as a fundamental wealth-building engine.
Historical Returns and Compounding Power
Historically, the S&P 500 has delivered an average annual return of approximately 10-12% over extended periods, including dividends. This track record, spanning decades, showcases the remarkable resilience and growth potential of the U.S. economy and its leading companies. Crucially, these average returns are not smooth; they encompass numerous market corrections, bear markets, and boom periods. The power of compounding—reinvesting earnings to generate further earnings—is what truly transforms these annual percentages into substantial wealth over decades. A modest initial investment, consistently added to and left untouched through market cycles, can grow exponentially thanks to compounding.
Investing in the S&P 500: ETFs and Index Funds
For most investors, directly buying all 500 S&P constituent stocks is impractical. Fortunately, there are highly efficient and low-cost ways to gain diversified exposure to the S&P 500: Exchange-Traded Funds (ETFs) and index mutual funds. These investment vehicles track the performance of the S&P 500 by holding either all 500 stocks or a representative sample.
Popular S&P 500 ETFs include SPDR S&P 500 ETF Trust (SPY), iShares Core S&P 500 (IVV), and Vanguard S&P 500 ETF (VOO). Similarly, many fund providers offer S&P 500 index mutual funds (e.g., Vanguard 500 Index Fund Admiral Shares, VFIAX). These funds offer instant diversification across 500 companies, significantly reducing single-stock risk, and typically come with very low expense ratios, making them an attractive option for long-term growth. Passive investing in such funds has consistently outperformed a large percentage of actively managed funds over the long run.

Navigating Volatility for Long-Term Wealth
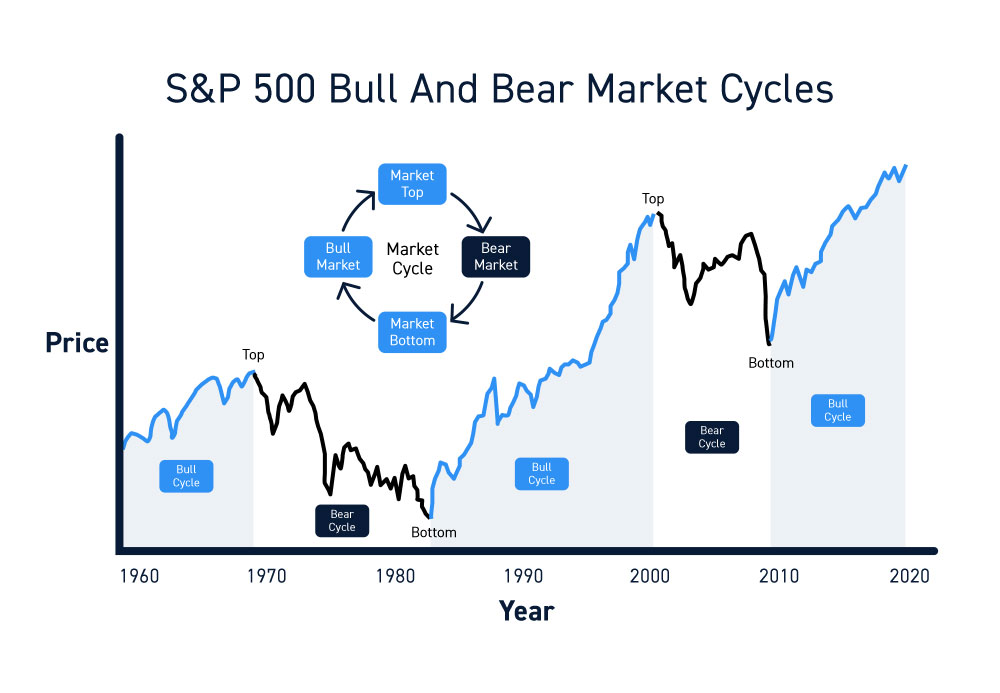
Market corrections (declines of 10-20%) and bear markets (declines of 20% or more) are inevitable parts of the investment landscape. While they can be unsettling, a long-term perspective views these downturns not as losses, but as potential opportunities to buy more assets at lower prices. The key to successful long-term investing in the S&P 500 is patience, discipline, and the ability to stay invested, even when markets are volatile. Time in the market, rather than timing the market, has consistently proven to be the most effective strategy for building wealth. By focusing on your long-term financial goals and adhering to a well-diversified strategy, the S&P 500 can serve as a powerful engine for your financial future, regardless of its daily trading level.
aViewFromTheCave is a participant in the Amazon Services LLC Associates Program, an affiliate advertising program designed to provide a means for sites to earn advertising fees by advertising and linking to Amazon.com. Amazon, the Amazon logo, AmazonSupply, and the AmazonSupply logo are trademarks of Amazon.com, Inc. or its affiliates. As an Amazon Associate we earn affiliate commissions from qualifying purchases.