
When investors, journalists, and casual observers ask, “How is the market doing?” they are almost always referring to the Dow Jones Industrial Average (DJIA). Despite the rise of more complex indices like the S&P 500 or the tech-heavy Nasdaq Composite, the “price” of the Dow remains the most cited barometer of the American economy. However, understanding what that price actually represents requires a deep dive into the mechanics of index construction, the history of blue-chip stocks, and the macroeconomic forces that move the needle.

The Dow Jones is not a standard stock; you cannot buy a “share” of the Dow in the way you buy a share of Apple or Coca-Cola. Instead, the price you see on financial news tickers—whether it is 35,000 or 40,000—is a weighted average of 30 prominent companies listed on stock exchanges in the United States. To truly understand the price of the Dow, one must look past the headline number and into the financial engine that drives it.
Understanding the Composition and Calculation of the Dow
The Dow Jones Industrial Average is unique among major global indices because of how its price is calculated. Unlike most modern indices, which are market-capitalization-weighted, the Dow is a price-weighted index. This distinction is fundamental to understanding why the index moves the way it does.
The Price-Weighted Model
In a price-weighted index, companies with higher share prices have a greater influence on the index’s total value than companies with lower share prices, regardless of their actual size or market value. For example, a company trading at $500 per share will have a significantly larger impact on the Dow’s daily movement than a company trading at $50 per share, even if the latter has a larger total market capitalization.
This methodology dates back to the index’s inception in 1896 by Charles Dow and Edward Jones. At the time, calculating a market-cap-weighted index would have been computationally impossible to do in real-time. By simply adding up the prices of the component stocks and dividing by the number of stocks, they created a shorthand for market health that persists to this day.
The Role of the Dow Divisor
One might assume that to find the “price” of the Dow, you simply add the prices of the 30 stocks and divide by 30. However, if a company in the index undergoes a stock split or if one company is replaced by another, a simple division would cause the index level to jump or drop sporadically, creating an inaccurate picture of market health.
To prevent this, the “Dow Divisor” was created. The divisor is a continuously adjusted mathematical constant used to maintain the continuity of the index. Whenever a component stock splits, pays a special dividend, or is swapped out, the divisor is adjusted so that the index value remains the same. Currently, the divisor is much less than one, meaning that a one-dollar move in any of the 30 component stocks results in a many-point move in the index itself. This leverage is why the Dow can gain or lose hundreds of points in a single afternoon based on the movement of just a few high-priced stocks.
Selecting the “Blue Chips”
The price of the Dow is reflective of 30 “blue-chip” companies. These are typically large, well-established, and financially sound corporations that represent the broad health of the U.S. economy. The selection process is not governed by a rigid formula but is instead managed by a committee at S&P Dow Jones Indices. They look for companies with excellent reputations, sustained growth, and interest among a broad range of investors. Because the Dow is meant to represent the total economy, it includes leaders in healthcare, technology, finance, consumer goods, and industrials.
The Macroeconomic Forces Driving the Price
The price of the Dow Jones does not move in a vacuum. Because its components are global powerhouses, the index is sensitive to a wide array of economic indicators and geopolitical shifts. For the individual investor, tracking these factors is essential for predicting where the “price” of the market is headed.
Corporate Earnings and Fundamental Health
At its core, the price of the Dow is a reflection of the profitability of its 30 components. During earnings season, when companies like Microsoft, Goldman Sachs, or UnitedHealth Group report their quarterly results, the Dow often experiences its highest volatility. If these companies report rising revenues and strong forward guidance, the index price climbs. Conversely, if rising input costs or cooling consumer demand eat into profit margins, the Dow will retreat.
Interest Rates and Federal Reserve Policy
Perhaps the most significant external driver of the Dow’s price is the U.S. Federal Reserve. The relationship between interest rates and the stock market is generally inverse. When the Fed raises interest rates to combat inflation, the cost of borrowing for corporations increases, which can slow down expansion and reduce corporate earnings. Furthermore, higher interest rates make fixed-income investments like bonds more attractive relative to stocks. As a result, when the Fed signals a “hawkish” or high-interest-rate stance, the Dow’s price often faces downward pressure.

Global Geopolitics and Trade
Given that the companies within the Dow Jones operate on a global scale, international stability is a major price factor. Trade wars, tariffs, and geopolitical conflicts in key regions can disrupt supply chains and increase costs for industrial giants like Boeing or Caterpillar. Because these companies are heavily weighted in the index, global unrest often manifests as a “flight to safety,” where investors sell off Dow components in favor of more stable assets, causing the index price to drop.
Comparing the Dow to Other Major Indices
To understand the value of the Dow’s price, it is helpful to compare it to other benchmarks like the S&P 500 and the Nasdaq. Each provides a different perspective on the financial landscape, and the Dow’s “price” tells a specific story that the others might miss.
Dow vs. S&P 500
The S&P 500 tracks 500 of the largest U.S. companies and is weighted by market capitalization. Most professional fund managers use the S&P 500 as their primary benchmark because it provides a broader look at the market. However, because the S&P 500 is market-cap-weighted, it is heavily influenced by a handful of “mega-cap” tech companies.
The Dow, by contrast, is often viewed as more “traditional.” Because it only contains 30 stocks and uses a price-weighted system, it can sometimes be more stable than the S&P 500 during tech sell-offs, but it may lag behind during massive bull markets driven by a few massive winners. When the Dow’s price is outperforming the S&P 500, it often indicates a rotation into “value” stocks—stable, dividend-paying companies that investors favor during times of uncertainty.
The Psychology of “Milestone” Prices
The price of the Dow is unique in its psychological impact on the public. When the Dow hits a major round number—such as 30,000 or 40,000—it generates massive media coverage. These milestones often act as psychological support or resistance levels. If the index struggles to break through a certain “price,” it can signal a lack of investor confidence. Once a milestone is breached, it often triggers a wave of “FOMO” (fear of missing out), driving the price even higher as retail investors jump back into the market.
How to Incorporate the Dow into Your Investment Strategy
For those looking to build wealth, the “price” of the Dow is more than just a number to watch on the news; it is an actionable investment opportunity. Since you cannot buy the index itself, you must use financial tools designed to track its performance.
Investing via ETFs and Index Funds
The most common way to “buy” the Dow is through an Exchange-Traded Fund (ETF) that mirrors the index. The most famous of these is the SPDR Dow Jones Industrial Average ETF Trust, known by its ticker symbol “DIA” (often referred to as “Diamonds”). By purchasing shares of DIA, you are essentially buying a basket of the 30 Dow stocks in their respective weightings. This provides instant diversification across various sectors of the economy through a single transaction.
Using the Dow for Market Timing and Sentiment
While “timing the market” is notoriously difficult, the Dow’s price can serve as a sentiment indicator. Long-term investors often look at the Dow’s “dividend yield.” Because many Dow components are mature companies that pay consistent dividends, a high yield for the index overall can suggest that the Dow’s price is undervalued relative to the income it generates. Conversely, a very low yield might suggest that the price has become overextended and a correction could be looming.
The Importance of Long-Term Perspective
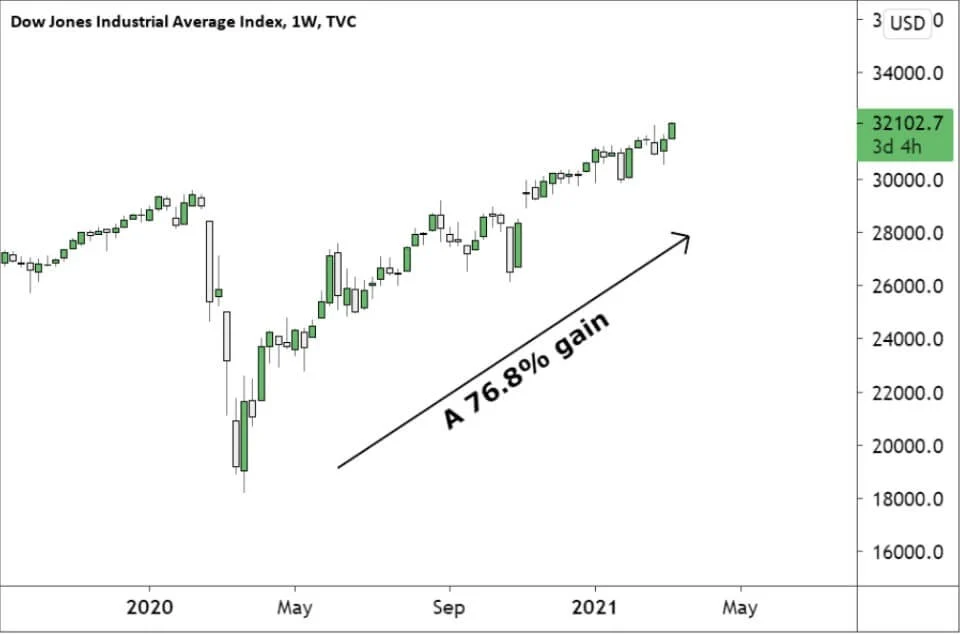
When looking at the price of the Dow Jones, it is easy to get caught up in daily fluctuations. A 500-point drop can feel catastrophic in the moment. However, history shows that the trajectory of the Dow’s price has been overwhelmingly positive over the long term. Since its inception, the index has survived depressions, world wars, and global pandemics, always eventually climbing to new highs. For the personal investor, the Dow serves as a reminder that American industry is resilient.
Interpreting the Numbers for Future Wealth
The price of the Dow Jones is a distillation of millions of data points, trade decisions, and economic realities into a single, digestible figure. While critics argue that its price-weighted methodology is an antiquated relic of the 19th century, its continued relevance proves its worth as a snapshot of corporate America.
To understand the price of the Dow is to understand the health of the giants that power our daily lives—the companies that provide our medicines, build our airplanes, and manage our finances. Whether the index is trading at record highs or experiencing a cyclical pullback, its price remains the most vital pulse-check for the global financial system. For those focused on personal finance and long-term investing, monitoring the Dow is not just about watching the numbers climb; it is about understanding the underlying strength of the economy and positioning oneself to benefit from the continued growth of the world’s leading enterprises.
aViewFromTheCave is a participant in the Amazon Services LLC Associates Program, an affiliate advertising program designed to provide a means for sites to earn advertising fees by advertising and linking to Amazon.com. Amazon, the Amazon logo, AmazonSupply, and the AmazonSupply logo are trademarks of Amazon.com, Inc. or its affiliates. As an Amazon Associate we earn affiliate commissions from qualifying purchases.