
The question “what is the price of corn per bushel” is more than a simple inquiry for farmers or grocery wholesalers; it is a fundamental metric in the world of global finance, commodity trading, and macroeconomics. Corn, often referred to in trading circles as “yellow gold,” is the most widely produced cereal crop globally. It serves as a cornerstone for food production, livestock feed, and industrial applications, including biofuel.
For the modern investor, the price of corn is a barometer for inflationary pressures and supply chain health. Understanding how this price is determined, what factors cause its volatility, and how to track it is essential for anyone looking to diversify their portfolio into the commodities sector.

Understanding the Fundamentals of Corn Pricing
To understand the price of corn, one must first understand the unit of measurement: the bushel. In the United States, a standard bushel of shelled corn weighs 56 pounds. The price you see quoted on financial news networks or trading platforms—such as the Chicago Board of Trade (CBOT)—represents the dollar amount paid for one of these 56-pound units.
The Role of the Chicago Board of Trade (CBOT)
The global benchmark for corn pricing is established at the Chicago Board of Trade, which is part of the CME Group. Here, corn is traded through futures contracts. A futures contract is a legal agreement to buy or sell corn at a predetermined price at a specified time in the future. Because these contracts are standardized, they provide a transparent “discovery” mechanism for the current and future value of corn. When people ask about the “price,” they are usually referring to the “spot price” (current delivery) or the “front-month futures price.”
Supply and Demand Dynamics
At its core, the price of corn is a function of basic economic theory. On the supply side, the United States, Brazil, China, and Argentina are the heavy hitters. Any disruption in these regions—be it labor strikes, equipment shortages, or infrastructure failures—can cause prices to spike. On the demand side, the market is driven by three main “pillars”: feed (livestock), fuel (ethanol), and exports. When global demand for protein rises, the need for corn to feed cattle and poultry increases, driving prices upward.
The Impact of the USDA WASDE Reports
For serious investors, the most important date on the calendar is the release of the World Agricultural Supply and Demand Estimates (WASDE) report by the United States Department of Agriculture (USDA). This report provides comprehensive data on projected production, usage, and “ending stocks” (the amount of corn left over at the end of the marketing year). If ending stocks are lower than anticipated, the “stocks-to-use” ratio tightens, and the price per bushel typically rallies.
Macroeconomic Factors That Influence Corn Prices
While supply and demand provide the foundation, corn does not exist in a vacuum. It is deeply integrated into the global financial ecosystem, making it sensitive to macro trends that affect “Money” at large.
Weather Patterns and Yield Forecasts
Agriculture is the only financial sector where a thunderstorm in Iowa or a drought in Mato Grosso can cause a 5% swing in asset value overnight. Precision is key here. High temperatures during the “silking” stage of corn growth can drastically reduce yields, lowering the total supply and increasing the price per bushel. Conversely, a “perfect” growing season leads to a bumper crop, which can saturate the market and depress prices.
Ethanol and Energy Market Correlations
In the United States, roughly 30% to 40% of the corn crop is diverted to the production of ethanol, a renewable fuel additive. This creates a strong correlation between the price of corn and the price of crude oil. When oil prices are high, ethanol becomes more economically viable, increasing the demand for corn. Investors often watch the energy sector as a leading indicator for where corn prices might head in the next quarter.
Geopolitical Tensions and Global Trade
Corn is a geopolitical tool. Trade wars, tariffs, and regional conflicts can close off major export markets instantly. For example, if a major buyer like China shifts its sourcing from the U.S. to Brazil due to trade tensions, U.S. domestic corn prices may fall due to a local surplus. Conversely, conflict in the “breadbasket” regions of Eastern Europe can remove millions of tons of grain from the global market, sending the price per bushel to historic highs.
Trading and Investing in Corn: Financial Vehicles
For those looking to capitalize on the fluctuations in corn prices, several financial instruments allow for exposure without ever having to take physical delivery of a single kernel.
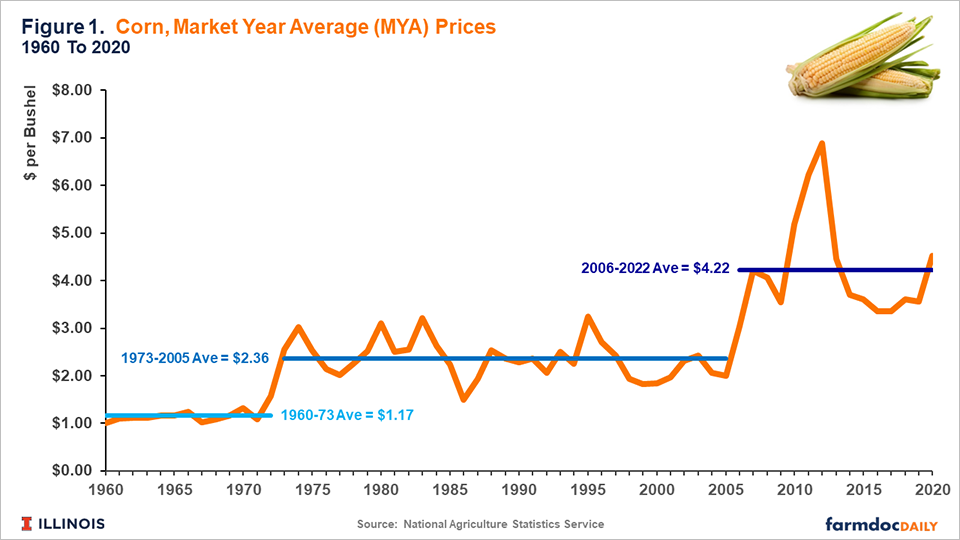
Corn Futures and Options
Direct trading on the CBOT is the most traditional route. Each standard corn futures contract represents 5,000 bushels. This requires a margin account and a deep understanding of leverage. While futures offer the most direct exposure to the price of corn per bushel, they are high-risk instruments. Professional traders use “options on futures” to hedge their bets, allowing them to profit from price movements while capping their potential losses.
Agricultural ETFs and ETNs
For the retail investor, Exchange-Traded Funds (ETFs) like the Teucrium Corn Fund (CORN) provide a more accessible entry point. These funds invest in a ladder of futures contracts, allowing investors to buy and sell “corn” just as they would a stock. It eliminates the need for a specialized commodities broker and integrates easily into a standard brokerage or retirement account.
Equities: Investing in the “Picks and Shovels”
Another way to play the corn market is by investing in the companies that support the industry. This includes seed and fertilizer giants like Corteva or Nutrien, and machinery manufacturers like John Deere. When the price of corn per bushel is high, farmers have more disposable income to spend on high-tech seeds and new tractors, making these stocks indirect beneficiaries of a bull market in grain.
The Influence of Currency and Inflation
As a dollar-denominated commodity, the value of corn is inextricably linked to the strength of the U.S. Dollar (USD). This is a crucial concept for anyone managing business finance or international portfolios.
The Inverse Relationship with the U.S. Dollar
Generally, when the U.S. Dollar is strong, corn prices tend to face downward pressure. This is because a strong dollar makes U.S. corn more expensive for foreign buyers using other currencies. To remain competitive on the global stage, the nominal price of the commodity often drops. Conversely, a weakening dollar can spark a rally in corn prices as international demand surges for relatively “cheaper” American grain.
Corn as an Inflation Hedge
Hard assets, including agricultural commodities, have historically served as a hedge against inflation. When the purchasing power of fiat currency declines, the nominal price of tangible goods like corn tends to rise. Including corn or broad agricultural indices in a diversified portfolio can provide a buffer during periods of monetary expansion or rising consumer price indices (CPI).
How to Monitor and Analyze Corn Price Data
In the digital age, tracking the price of corn per bushel involves more than just reading the morning paper. Financial technology has provided tools that allow for real-time analysis and predictive modeling.
Real-Time Financial Dashboards
Platforms like Bloomberg Terminal, Reuters Eikon, or even free services like CNBC and Barchart provide tick-by-tick data on corn futures. Investors should look at the “Basis”—the difference between the local cash price and the futures price. A “narrowing basis” indicates strong local demand, which can be a precursor to a rise in the national futures price.
Seasonal Trends and Cyclical Patterns
Corn prices often follow a “seasonal” trend. Prices are frequently at their lowest during the fall harvest when supply is at its peak. Conversely, prices often “risk-premium” into the late spring and early summer during the planting and pollination phases. Understanding these cycles allows investors to time their entries and exits with greater statistical probability of success.
Technical Analysis in Commodities
Many commodity traders use technical indicators such as Moving Averages, the Relative Strength Index (RSI), and Fibonacci retracements to identify support and resistance levels for corn. While fundamental analysis (weather, WASDE reports) tells you why the price might move, technical analysis helps determine when to execute the trade.

Conclusion: Why Corn Prices Matter to Your Bottom Line
The price of corn per bushel is a vital economic indicator that touches almost every corner of the financial world. From the cost of a steak at a restaurant (feed costs) to the price of gasoline (ethanol blends) and the performance of emerging market currencies, the ripples of the corn market are far-reaching.
For the investor, corn represents a unique asset class that offers low correlation to traditional stocks and bonds, providing essential diversification. By staying informed on USDA reports, monitoring the U.S. Dollar, and understanding the seasonal cycles of the “corn belt,” one can navigate this volatile market with professional insight. Whether you are hedging against inflation or seeking speculative gains in the futures market, the price of corn remains one of the most significant numbers in global finance.
aViewFromTheCave is a participant in the Amazon Services LLC Associates Program, an affiliate advertising program designed to provide a means for sites to earn advertising fees by advertising and linking to Amazon.com. Amazon, the Amazon logo, AmazonSupply, and the AmazonSupply logo are trademarks of Amazon.com, Inc. or its affiliates. As an Amazon Associate we earn affiliate commissions from qualifying purchases.