In the realm of data analysis and statistical inference, understanding the fundamental concepts is paramount. Among these foundational elements, the “population parameter” stands out as a critical concept that underpins our ability to draw meaningful conclusions about a larger group based on a smaller sample. While the title might sound technical, its implications extend far beyond academic circles, influencing everything from market research and scientific studies to the development of sophisticated technological algorithms. For those operating within the technological landscape, a firm grasp of population parameters is not just beneficial; it’s a cornerstone for building effective models, interpreting data accurately, and making informed decisions about product development and user experience. This article will delve into the definition, significance, and various types of population parameters, with a specific focus on their relevance and application within the technology sector.
Defining the Population Parameter in a Technological Context
At its core, a population parameter is a numerical value that describes a characteristic of an entire population. The “population” in this context refers to the complete set of all individuals, items, or observations that a researcher or analyst is interested in studying. This could be every smartphone user in a particular country, all the servers in a global cloud infrastructure, every line of code in a specific software repository, or every transaction processed by a financial technology platform.
The key distinction lies in the scope: a parameter describes the entire population, whereas a statistic describes a sample drawn from that population. For instance, if we want to know the average processing speed of all CPUs manufactured by a company (the population), that average speed would be the population parameter. If we measure the processing speed of a random selection of 100 CPUs (a sample) and calculate their average speed, that calculated average would be a sample statistic. The goal of much statistical analysis in technology is to use sample statistics to estimate or infer the unknown population parameters.
The Importance of Population Parameters in Data-Driven Technology
In the fast-paced world of technology, data is the lifeblood of innovation and improvement. Every app update, every AI model training, every cybersecurity defense strategy, and every user interface design decision is often informed by data. Understanding population parameters is crucial for several reasons:
- Accurate Representation: When we can accurately estimate or understand population parameters, we gain a true representation of the phenomena we are studying. This prevents us from making flawed assumptions based on incomplete or biased data.
- Informed Decision-Making: Whether it’s deciding on the optimal user experience for a new application, predicting the failure rate of hardware components, or understanding customer behavior, accurate population parameters lead to better-informed decisions that can significantly impact product success and resource allocation.
- Model Development and Validation: Machine learning models, for example, are trained on data. The effectiveness of these models often hinges on their ability to generalize to unseen data, which is directly related to how well they capture the underlying population parameters. Validating model performance against known or estimated population parameters is a critical step.
- Trend Analysis and Forecasting: Understanding the historical trends of population parameters allows technology companies to forecast future behavior, identify emerging patterns, and proactively adapt their strategies. This is vital for staying competitive in rapidly evolving markets.
- Performance Benchmarking: When assessing the performance of a new algorithm, a new piece of hardware, or a network’s efficiency, comparing it against established population parameters provides a objective benchmark for success.
Distinguishing Parameters from Statistics
The distinction between a population parameter and a sample statistic is fundamental to statistical inference.
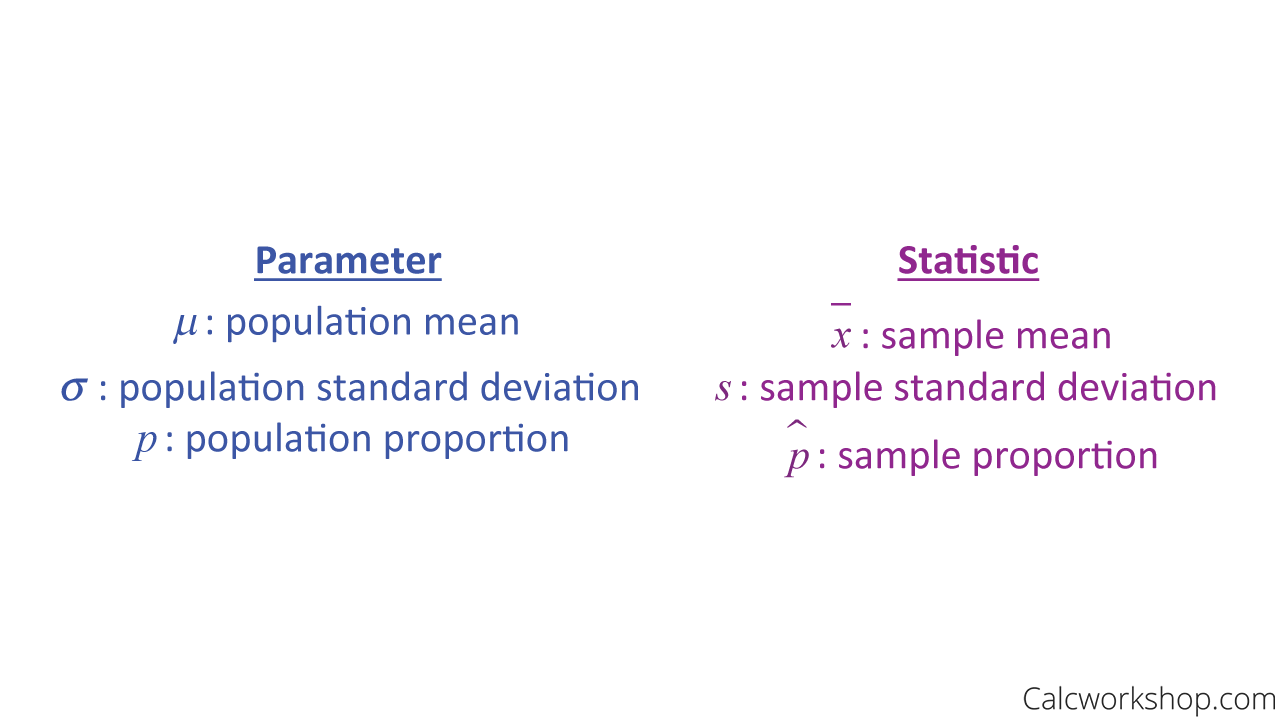
- Population Parameter: A value that summarizes a characteristic of the entire population. These are often unknown and are the targets of statistical estimation. They are typically represented by Greek letters (e.g., $mu$ for population mean, $sigma$ for population standard deviation, $p$ for population proportion).
- Sample Statistic: A value that summarizes a characteristic of a sample drawn from the population. These are calculated from sample data and are used to estimate population parameters. They are typically represented by Latin letters (e.g., $bar{x}$ for sample mean, $s$ for sample standard deviation, $hat{p}$ for sample proportion).
The process of inferential statistics involves using sample statistics to make educated guesses about the values of population parameters. This is an iterative process of data collection, analysis, and refinement.
Types of Population Parameters in Technology
Population parameters can take various forms, depending on the characteristic being measured. In technology, these parameters are often used to describe aspects of users, systems, data, and performance.
Measures of Central Tendency
These parameters describe the typical or central value of a population.
-
Population Mean ($mu$): The average value of a numerical characteristic across the entire population.
- Tech Example: The average response time of all servers in a global data center. This is crucial for ensuring service level agreements (SLAs) are met and for optimizing network latency.
- Tech Example: The average number of daily active users (DAU) for a mobile application. This metric is a key indicator of an app’s engagement and success.
- Tech Example: The average bandwidth consumption per user in a telecommunications network. This helps in capacity planning and identifying potential bottlenecks.
-
Population Median: The middle value of a numerical characteristic when the population is ordered from least to greatest. It is less affected by extreme outliers than the mean.
- Tech Example: The median download speed experienced by all users in a region. This can provide a more representative picture of typical user experience than the mean, especially if some users have exceptionally high or low speeds.
- Tech Example: The median session duration for users interacting with a particular feature on a website. This helps understand typical engagement levels for that feature.
-
Population Mode: The most frequently occurring value of a characteristic in the population.
- Tech Example: The most common operating system version used by users of a particular software. This is vital for prioritizing development and testing efforts.
- Tech Example: The most frequently purchased product category on an e-commerce platform. This informs inventory management and marketing strategies.
Measures of Dispersion (Variability)
These parameters describe how spread out or varied the data is within a population.
-
Population Variance ($sigma^2$): The average of the squared differences from the mean. It quantifies the spread of the data.
- Tech Example: The variance in network latency across all connections to a server. A high variance suggests inconsistent performance, which can be detrimental for real-time applications.
- Tech Example: The variance in the number of errors per million lines of code for a software project. This can indicate the stability and quality of different modules.
-
Population Standard Deviation ($sigma$): The square root of the population variance. It is expressed in the same units as the data and is easier to interpret than variance.
- Tech Example: The standard deviation of response times for an API. A low standard deviation implies consistent and predictable response times, which is essential for reliable service.
- Tech Example: The standard deviation in the time it takes for a user to complete a specific task within an application. This helps identify areas where user experience might be inconsistent.
Measures of Association and Distribution
These parameters describe relationships between variables or the shape of the data distribution.
- Population Correlation Coefficient ($rho$): A measure of the strength and direction of the linear relationship between two numerical variables in the population.
- Tech Example: The correlation between the number of features used by a customer and their annual subscription value. Understanding this can help in product development and pricing strategies.
- Tech Example: The correlation between server load and response time. This is crucial for performance tuning and capacity planning.

- Population Proportion ($p$): The proportion of individuals or items in the population that possess a certain characteristic.
- Tech Example: The proportion of users who have enabled two-factor authentication (2FA) for a cybersecurity service. This is a key metric for assessing security adoption.
- Tech Example: The proportion of successful transactions processed by a payment gateway. This directly impacts revenue and customer trust.
- Tech Example: The proportion of users who click on a specific call-to-action button on a website. This is vital for A/B testing and conversion rate optimization.
Inferring Population Parameters: The Role of Sampling and Estimation
Since it is often impossible or impractical to collect data from an entire population, statisticians rely on sampling to make inferences about population parameters.
The Art and Science of Sampling
Sampling involves selecting a subset of individuals or items from a population to gather data. The quality of the inferences made about population parameters depends heavily on the representativeness of the sample.
-
Random Sampling: Involves selecting sample members such that each member of the population has an equal and independent chance of being included. This minimizes bias and increases the likelihood that the sample statistic will be a good estimator of the population parameter.
- Tech Application: Randomly selecting users to participate in a beta test of new software to gather feedback that generalizes to the broader user base.
- Tech Application: Randomly choosing servers to monitor for performance metrics to estimate the overall system health.
-
Stratified Sampling: Dividing the population into subgroups (strata) based on shared characteristics and then taking random samples from each stratum.
- Tech Application: For an e-commerce site, stratifying users by geographic region and then randomly sampling within each region to understand purchasing patterns across different markets.
- Tech Application: In cybersecurity, stratifying network devices by type (e.g., routers, firewalls, servers) and then sampling each stratum to assess vulnerability profiles.
-
Cluster Sampling: Dividing the population into clusters and then randomly selecting entire clusters to sample.
- Tech Application: For a global tech company with multiple office locations, randomly selecting several offices (clusters) and then surveying all employees within those selected offices to gauge employee satisfaction.
Estimation Techniques
Once a sample has been collected, estimation techniques are used to infer the population parameters.
-
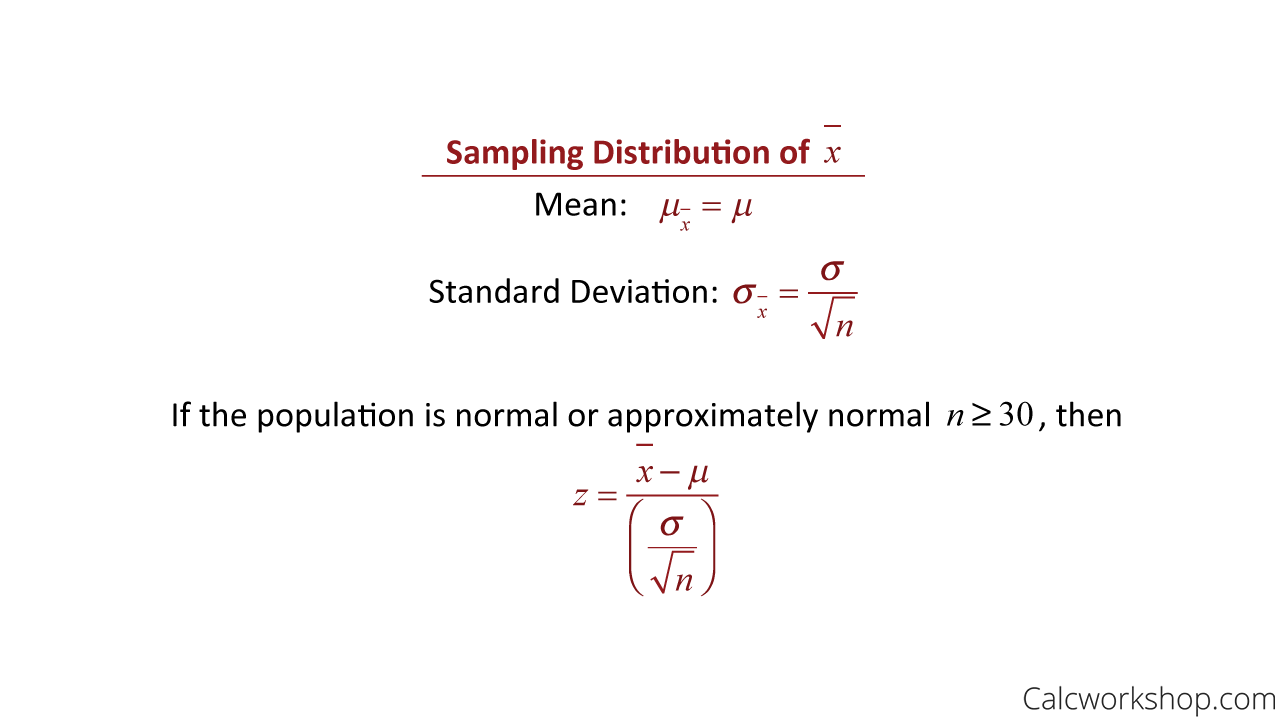
Point Estimation: Using a single sample statistic to estimate a population parameter. For example, using the sample mean ($bar{x}$) to estimate the population mean ($mu$). While straightforward, point estimates do not convey the uncertainty associated with the estimation.
- Tech Implication: A marketing team might use the sample proportion of clicks on an ad to provide a single point estimate for the true click-through rate of the population of potential customers.
-
Interval Estimation (Confidence Intervals): Providing a range of values within which the population parameter is likely to lie, with a certain level of confidence. This acknowledges the inherent uncertainty in using sample data.
- Tech Implication: A software development team might report that they are 95% confident that the true average bug-fixing time for their entire codebase lies between 2.5 and 4.0 hours. This provides a more nuanced understanding than a single point estimate.
- Tech Implication: A data scientist might construct a confidence interval for the population proportion of users who prefer a new feature, giving stakeholders a range of likely adoption rates.
Challenges and Considerations in Parameter Estimation
While the concepts of population parameters and their estimation are powerful, there are inherent challenges and considerations that technology professionals must address.
Bias in Sampling and Measurement
Bias can creep into the data collection process, leading to sample statistics that systematically differ from population parameters.
-
Selection Bias: Occurs when the sampling method is flawed, and certain individuals or items have a higher or lower probability of being selected than they should.
- Tech Scenario: A survey about app usage conducted only among users who have opted into receiving promotional emails might overrepresent highly engaged users and underestimate the usage of less engaged users.
-
Measurement Bias: Occurs when the way data is collected or the instruments used introduce systematic errors.
- Tech Scenario: A performance benchmark for a new algorithm that is run on a highly optimized server configuration might overestimate its typical performance in a less controlled production environment.
The Ever-Evolving Nature of Technological Populations
In technology, populations are rarely static. User bases grow and change, hardware gets updated, and software evolves. This dynamism presents a continuous challenge for parameter estimation.
-
Concept Drift: The statistical properties of the target variable, which the model is trying to predict, change over time in the way that a data stream is non-stationary.
- Tech Scenario: User preferences for streaming content can change rapidly. A model trained on historical data to predict viewing habits might become less accurate over time as user tastes evolve. This requires continuous retraining and updating of models to reflect current population parameters.
-
Population Shift: The characteristics of the population itself change.
- Tech Scenario: The introduction of new mobile devices with different screen sizes and processing capabilities shifts the population of users accessing a web application. Parameters related to page load times or optimal layout might need to be re-evaluated.
Practical Implications for Tech Professionals
For developers, data scientists, product managers, and strategists in the tech industry, understanding population parameters translates into tangible benefits:
- Optimized User Experience: By accurately estimating parameters like average session duration, task completion rates, or error frequency, teams can identify pain points and design interfaces that cater to the typical user.
- Efficient Resource Allocation: Knowing the population mean of server load, bandwidth consumption, or storage needs allows for more accurate capacity planning and cost optimization.
- Effective Marketing and Personalization: Understanding population proportions of customer segments, their preferences, or their engagement levels enables targeted marketing campaigns and personalized user experiences.
- Robust Algorithm Development: Machine learning models are built to generalize. By understanding the underlying population parameters that a model should capture, data scientists can develop more accurate and reliable algorithms.
- Informed Product Roadmaps: Analyzing trends in population parameters related to feature adoption, user growth, or market adoption rates can guide future product development and strategic decisions.
In conclusion, the concept of the population parameter, while rooted in statistics, is an indispensable tool for anyone working with data in the technology sector. It provides the benchmark against which we measure, understand, and improve the complex systems and user experiences that define our digital world. By diligently defining, sampling, and estimating these parameters, technology professionals can move beyond anecdotal evidence and make data-driven decisions that lead to greater innovation, efficiency, and success.
aViewFromTheCave is a participant in the Amazon Services LLC Associates Program, an affiliate advertising program designed to provide a means for sites to earn advertising fees by advertising and linking to Amazon.com. Amazon, the Amazon logo, AmazonSupply, and the AmazonSupply logo are trademarks of Amazon.com, Inc. or its affiliates. As an Amazon Associate we earn affiliate commissions from qualifying purchases.