
In the intricate world of finance, where numbers tell stories of growth, decline, opportunity, and risk, few metrics are as universally applied and fundamentally insightful as “percent change.” Far more than a simple mathematical calculation, understanding percent change is the bedrock of informed decision-making for individuals, investors, and businesses alike. It quantifies the relative shift between two values, translating raw numbers into actionable insights that reveal trends, measure performance, and highlight significant deviations. Without this critical tool, financial analysis would be a mere catalog of figures, devoid of the crucial context needed to interpret progress, identify red flags, or project future outcomes.
Whether you’re tracking the growth of your investment portfolio, analyzing the fluctuations in your monthly budget, or assessing the quarterly revenue performance of a company, percent change provides the lens through which these numbers gain meaning. It allows for apples-to-apples comparisons across different scales and timeframes, making it an indispensable component of financial literacy and strategic planning. This article will delve into the essence of percent change, explore its diverse applications across personal finance, investing, and business operations, and highlight best practices for its effective use.
The Core Concept: Understanding Percent Change
At its heart, percent change is a metric that expresses the difference between an old (or base) value and a new value as a percentage of the old value. It’s a powerful way to standardize changes, making them comparable regardless of the absolute magnitude of the numbers involved.
Defining Percent Change in Financial Context
In finance, percent change is frequently used to evaluate the performance of assets, the impact of economic events, or the efficiency of financial management. For instance, knowing that your stock portfolio increased by $1,000 is useful, but knowing it increased by 10% tells you much more about its performance relative to the initial investment and market benchmarks. Similarly, understanding that your electricity bill increased by 5% this month, rather than just by $7, provides a clearer picture of the relative impact on your budget and potential underlying causes.
The ability to express changes in percentage terms allows for a common language across various financial reports and discussions. It normalizes data, enabling stakeholders to grasp the proportional significance of changes, whether dealing with millions in corporate revenue or hundreds in personal savings.
The Fundamental Formula: Calculation and Interpretation
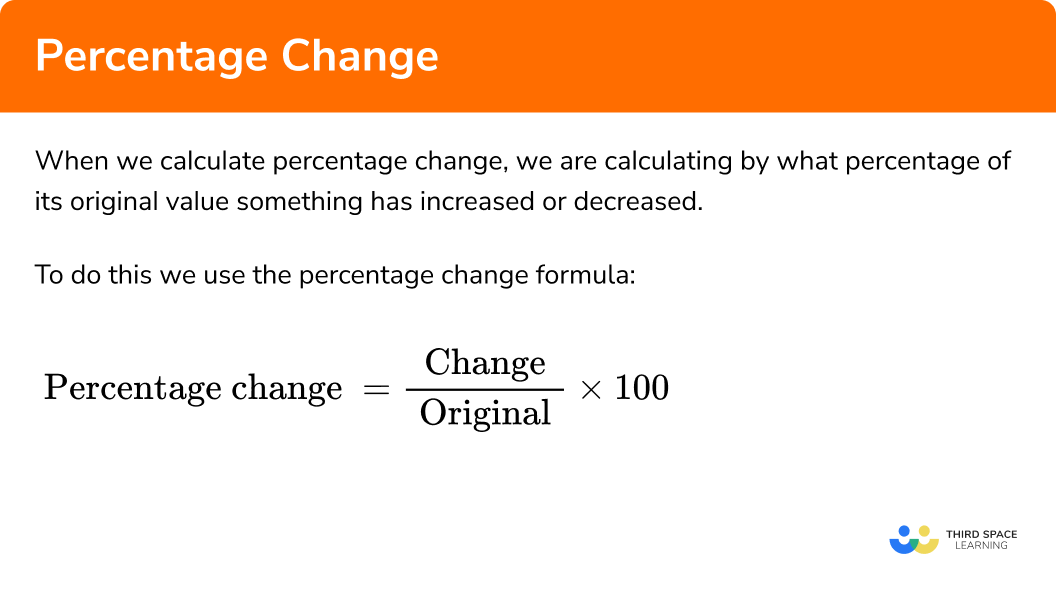
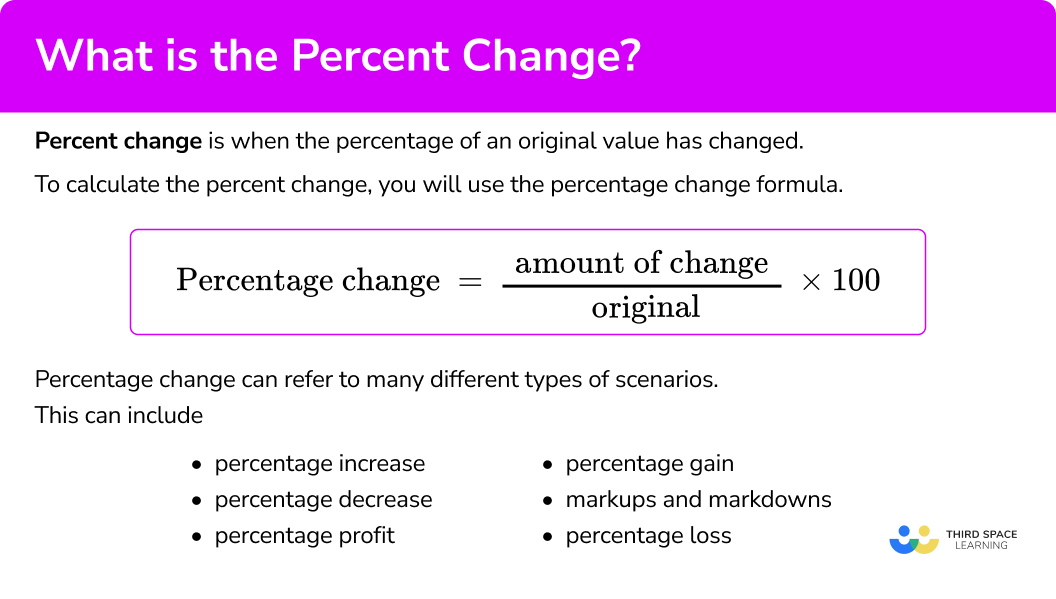
The formula for calculating percent change is straightforward:
Percent Change = ((New Value – Old Value) / Old Value) * 100
Let’s break down its components:
- New Value: The value after the change has occurred.
- Old Value: The initial or baseline value.
- Difference (New Value – Old Value): This calculates the absolute amount of change.
- Division by Old Value: This step normalizes the change by relating it to the starting point, converting it into a decimal representing the proportional change.
- Multiplication by 100: Converts the decimal into a percentage.
Interpretation:
- A positive percent change indicates growth or an increase.
- A negative percent change indicates shrinkage or a decrease.
- A zero percent change means no change occurred.
For example, if your investment account grew from $10,000 (Old Value) to $11,500 (New Value):
Percent Change = (($11,500 – $10,000) / $10,000) * 100
Percent Change = ($1,500 / $10,000) * 100
Percent Change = 0.15 * 100
Percent Change = 15%
This means your account grew by 15%.
Conversely, if a stock price dropped from $100 to $90:
Percent Change = (($90 – $100) / $100) * 100
Percent Change = (-$10 / $100) * 100
Percent Change = -0.10 * 100
Percent Change = -10%
The stock price decreased by 10%.
Why it Matters: Beyond Simple Numbers
Percent change offers several critical advantages over absolute change:
- Contextualization: It puts changes into perspective. A $100 increase in a $1,000 portfolio is significant (10%), while a $100 increase in a $100,000 portfolio is minor (0.1%).
- Comparability: It allows for comparing changes across vastly different scales. You can compare the growth rate of a small startup to that of a multinational corporation, or the return on a low-cost index fund to a high-growth tech stock.
- Benchmarking: It’s essential for comparing performance against benchmarks, such as market indices (e.g., S&P 500) or industry averages.
- Trend Identification: Consistent positive or negative percent changes over time reveal underlying trends, helping to predict future movements or identify areas needing attention.
Percent Change in Personal Finance: Tracking Your Financial Journey
For individuals, percent change is an invaluable tool for understanding and managing personal finances, empowering better budgeting, saving, and debt reduction strategies.
Monitoring Savings and Investments Growth
Tracking the growth of your savings accounts, retirement funds, and personal investments using percent change allows you to gauge how effectively your money is working for you. A 7% annual growth rate on your retirement account is a clear indicator of performance, far more informative than simply seeing a dollar amount increase. It helps you assess if your financial goals are on track and if your investment strategies are yielding desired returns relative to inflation and market conditions. This metric is crucial for long-term financial planning, allowing you to project future values and adjust contributions as needed.
Budgeting and Expense Analysis: Identifying Trends
When it comes to budgeting, percent change is fundamental for analyzing spending patterns and identifying areas for adjustment. Comparing your expenses month-over-month or year-over-year in percentage terms reveals trends quickly. For example, if your grocery bill consistently shows a 15% increase for three consecutive months, it signals a trend that needs investigation – perhaps due to rising food prices, changing habits, or an oversight in tracking. Conversely, a 10% decrease in dining-out expenses might indicate successful lifestyle changes. This granular analysis empowers you to make informed decisions about where to cut back or allocate more resources, optimizing your cash flow and ensuring you live within your means.
Debt Management and Progress Measurement
Managing debt effectively requires a clear understanding of your progress. Percent change helps illustrate the speed at which you are reducing your liabilities. Seeing your credit card balance decrease by 20% in a quarter provides tangible proof of progress, motivating you to continue your debt repayment efforts. It also helps in evaluating the effectiveness of different debt reduction strategies (e.g., debt snowball vs. debt avalanche) by comparing their impact on your total debt burden over time. For mortgage holders, understanding the percent change in equity over time can be a powerful indicator of wealth building.
Percent Change in Investing: Gauging Performance and Opportunity
In the investment world, percent change is the lingua franca. It underpins almost every performance metric, allowing investors to analyze, compare, and make critical decisions about their portfolios.
Analyzing Stock Returns and Portfolio Performance
Investors live by percent change. The daily, weekly, monthly, and annual returns of individual stocks, bonds, mutual funds, and entire portfolios are almost always expressed as a percentage. A stock’s price moving from $50 to $55 represents a 10% gain, instantly comparable to a different stock moving from $10 to $11, which also represents a 10% gain, despite the vastly different absolute dollar changes. This standardization is vital for constructing diversified portfolios and evaluating which assets are outperforming or underperforming. Investors use percent change to compare their portfolio’s performance against market indices (e.g., “my portfolio returned 12% this year, while the S&P 500 returned 10%”), indicating relative success.
Market Movements and Sectoral Shifts
Beyond individual assets, percent change is crucial for understanding broader market dynamics. News reports frequently highlight how major indices like the Dow Jones Industrial Average, NASDAQ, or FTSE 100 have changed by a certain percentage in a day or week. These figures quickly convey the market sentiment – a 2% drop signals a down day, while a 1% rise indicates positive momentum. Investors also use percent change to track sectoral performance, identifying which industries are growing or shrinking relative to others. If the tech sector shows a 20% growth year-to-date while the energy sector shows a 5% decline, it helps investors allocate capital strategically.
Risk Assessment and Volatility Insights
Percent change is also a key component in assessing investment risk and volatility. High percent changes (both positive and negative) over short periods indicate higher volatility, meaning the investment’s value fluctuates significantly. While this can offer opportunities for rapid gains, it also carries a higher risk of rapid losses. Low percent changes, conversely, suggest more stability. Metrics like “standard deviation” of returns, which measures volatility, are built upon the concept of calculating the percent change of an asset’s price over time. Understanding these percentage fluctuations helps investors align their portfolio with their personal risk tolerance.
Percent Change in Business Finance: Driving Strategic Decisions
For businesses, percent change is indispensable for financial analysis, operational management, and strategic planning. It helps executives and managers interpret financial statements, assess performance, and make data-driven decisions.
Revenue Growth, Profitability, and Cost Control
Every business owner and manager closely monitors percent change in key financial metrics.
- Revenue Growth: A company’s top priority is often to grow its revenue. Reporting a 15% year-over-year revenue increase is a strong indicator of market success and operational effectiveness.
- Profitability: Tracking gross profit margin (gross profit as a percentage of revenue) and net profit margin (net profit as a percentage of revenue) helps assess a company’s efficiency in converting sales into profit. Changes in these percentages over time reveal trends in cost management and pricing strategies.
- Cost Control: Businesses constantly analyze changes in their operating expenses. A 10% increase in administrative costs without a corresponding increase in revenue might signal inefficiencies, prompting management to investigate and implement cost-cutting measures. Conversely, a decrease in costs as a percentage of revenue indicates improved efficiency.
Market Share and Competitive Analysis
Percent change is vital for understanding a company’s position within its industry. Tracking the percent change in market share helps a business assess its competitive standing. If a company’s market share increases by 2% while the overall market grows by 5%, it indicates that the company is outperforming its competitors. Conversely, a declining market share suggests a loss of competitive edge. This analysis is crucial for strategic planning, product development, and marketing efforts.
Financial Ratios and Health Indicators
Many critical financial ratios, such as return on equity, return on assets, and current ratio, are often analyzed for their percent change over time. Monitoring the percent change in these ratios helps assess a company’s financial health, liquidity, solvency, and operational efficiency. For instance, a consistent decline in the percent change of the current ratio (current assets / current liabilities) might indicate a deteriorating ability to meet short-term obligations, signaling a need for corrective action. Investors and creditors heavily rely on these trends when evaluating a company’s financial stability and investment potential.
Common Pitfalls and Best Practices When Using Percent Change
While incredibly powerful, percent change can be misleading if not interpreted carefully and with proper context. Understanding its limitations is as important as understanding its calculation.
Understanding the Base Value: The Starting Point Matters
The “Old Value” or base value is critical to the interpretation of percent change.
- Small Base Values: A large percent change originating from a very small base value can be deceptively dramatic. For example, increasing a base of $10 to $20 is a 100% increase, which sounds impressive, but it’s only a $10 absolute change. In business, a 1000% revenue growth from $1,000 to $11,000 might seem astronomical, but it’s still a relatively small company. It’s crucial to consider the absolute numbers alongside the percentages, especially when comparing entities of different scales.
- Negative Base Values: Calculating percent change from a negative base value can lead to nonsensical results or require specific alternative formulas (e.g., using absolute values in certain contexts). In most financial applications, percent change is calculated from positive values, representing assets, revenue, or costs. If you encounter negative base values, it’s often better to focus on absolute changes or use different metrics.
- Zero Base Values: Division by zero is undefined. If the old value is zero, percent change cannot be calculated in the standard way. For example, if a product had no sales last year and now has 100 sales, you can’t calculate a percent change directly. Instead, you’d state the absolute number of new sales.
Annualization vs. Period-Specific Changes
Financial data is often presented over various timeframes (daily, weekly, monthly, quarterly, annually). It’s vital to compare percent changes over consistent periods. A 2% gain in a single day is very different from a 2% gain over a year.
- Annualizing Returns: To compare performance across different investment durations, investors often annualize returns. If an investment gained 5% in a quarter, annualizing it (assuming constant performance) would suggest a 21.55% annual return (1.05^4 – 1). However, simple multiplication (e.g., 5% * 4 = 20%) can be misleading due to compounding.
- Comparing Consistent Periods: Always ensure you are comparing like with like. Comparing a quarter-over-quarter percent change to a year-over-year percent change without adjustment will lead to erroneous conclusions.

Context is King: Avoiding Misinterpretation
A percent change figure, in isolation, tells only part of the story. Its true meaning emerges only when placed within its broader context.
- Industry Benchmarks: A 10% revenue growth might sound good, but if the industry average is 20%, then the company is underperforming. Conversely, a 3% growth might be excellent in a contracting industry.
- Economic Conditions: A 5% increase in unemployment might be alarming during an economic boom but less concerning during a deep recession.
- Underlying Factors: Understanding why a change occurred is often more important than the change itself. Did revenue grow 20% due to a new innovative product, or simply due to price increases? Was the 15% increase in expenses due to necessary investment in growth or due to mismanagement?
- Cumulative vs. Non-Cumulative: Be aware of whether a percent change is cumulative (e.g., total return over five years) or non-cumulative (e.g., year-over-year growth for a specific year).
In conclusion, percent change is a cornerstone of financial analysis, providing crucial context and comparability that raw numbers simply cannot. From navigating personal budgets and investments to steering corporate strategies, its intelligent application empowers individuals and organizations to make informed decisions. However, like any powerful tool, it demands careful handling, a clear understanding of its nuances, and a rigorous commitment to contextual interpretation to unlock its full potential. By mastering percent change, you gain a vital lens through which to view and master your financial world.
aViewFromTheCave is a participant in the Amazon Services LLC Associates Program, an affiliate advertising program designed to provide a means for sites to earn advertising fees by advertising and linking to Amazon.com. Amazon, the Amazon logo, AmazonSupply, and the AmazonSupply logo are trademarks of Amazon.com, Inc. or its affiliates. As an Amazon Associate we earn affiliate commissions from qualifying purchases.