The question “what is the Nasdaq at?” is a common one, frequently posed by investors, financial analysts, and even curious onlookers keen to gauge the health of the technology sector and, by extension, the broader stock market. It’s more than just a fleeting inquiry; it’s an immediate demand for real-time data, a snapshot of market sentiment, and a crucial piece of information for making informed financial decisions. The Nasdaq, particularly the Nasdaq Composite Index, is synonymous with innovation, growth, and the cutting edge of technology, making its daily, hourly, and even minute-by-minute movements a focal point for millions.

At its core, understanding “what the Nasdaq is at” means deciphering its current index level, the numerical representation of the collective performance of the thousands of companies listed on the Nasdaq Stock Market. This number isn’t static; it’s a dynamic reflection of countless factors, from company earnings and economic data to geopolitical events and shifts in investor confidence. For anyone engaged in personal finance, investing, or even simply tracking economic trends, grasping the significance of the Nasdaq’s current standing is fundamental. This article will delve into what the Nasdaq represents, how its current level is determined, the forces that shape its movements, and why its performance holds such sway over the investment world.
Unpacking the Nasdaq Composite: More Than Just a Number
To truly appreciate the significance of “what the Nasdaq is at,” one must first understand what the Nasdaq Composite Index actually is. Unlike the Dow Jones Industrial Average, which is price-weighted and composed of just 30 large companies, or the S&P 500, which is market-cap-weighted and represents 500 large U.S. companies, the Nasdaq Composite is a market-capitalization-weighted index of all common equities listed on the Nasdaq stock market. This crucial distinction means that larger companies have a greater impact on the index’s movement than smaller ones.
A Brief History and Its Tech-Centric Identity
The Nasdaq Stock Market was founded in 1971 as the world’s first electronic stock market. Its origins were rooted in providing a more efficient and transparent way to trade over-the-counter (OTC) stocks. Over time, it evolved into a listing venue of choice for nascent and rapidly growing technology companies. This preference wasn’t accidental; the Nasdaq’s electronic nature aligned perfectly with the innovative spirit of these firms. As a result, the Nasdaq Composite became, and remains, heavily concentrated in the technology and growth sectors. Giants like Apple, Microsoft, Amazon, Google (Alphabet), and Meta Platforms (Facebook) are cornerstones of the index, their performance often dictating the overall direction of the Nasdaq. This tech-heavy composition makes the Nasdaq Composite a de facto barometer for the health and performance of the technology sector globally. When investors ask “what is the Nasdaq at,” they are often implicitly asking about the state of tech stocks.
Key Drivers Behind Nasdaq’s Performance
The current level of the Nasdaq is a culmination of various forces, primarily driven by the collective performance of its constituent companies. Corporate earnings reports are perhaps the most significant immediate driver. Strong earnings, revenue growth, and optimistic forward guidance from major tech companies can send the index soaring, while disappointing results can trigger sell-offs. Beyond individual company performance, broader economic conditions play a pivotal role. Low interest rates, for instance, tend to favor growth stocks, as they make future earnings streams more valuable and borrowing cheaper for expansion. Conversely, rising interest rates can dampen enthusiasm for growth stocks, as they increase borrowing costs and make future profits less attractive when discounted back to present value. Innovation itself is another implicit driver; groundbreaking products, services, or technological advancements within the tech sector can generate significant investor excitement and capital inflows, pushing the Nasdaq higher.
Decoding “What It’s At”: Real-time Metrics and Their Significance
When someone asks “what is the Nasdaq at?”, they are looking for its latest numerical value. This value is continuously updated throughout trading hours, reflecting the constant ebb and flow of buying and selling activity. But the raw number alone doesn’t tell the whole story; understanding its context requires looking at several other metrics.
Understanding Index Points and Percentage Changes
The Nasdaq Composite’s value is expressed in “points.” For example, if the Nasdaq is “at” 15,000 points, this is its current index level. More critical than the absolute number, however, is the change in points and the percentage change from the previous day’s close. A movement of 100 points might be a significant percentage change at lower index levels, but less so at higher levels. Therefore, the percentage change provides a more accurate and standardized way to gauge the magnitude of the day’s movement. A 1% gain on a day when the Nasdaq is at 15,000 means a 150-point increase, indicating a broadly positive sentiment for the day. Conversely, a 2% drop signals a notable downturn. These percentage changes are what analysts and investors primarily focus on to assess daily market performance.
The Role of Volume and Market Breadth
Beyond the index points and percentage change, other real-time metrics offer deeper insights into “what the Nasdaq is at.” Trading volume indicates the total number of shares traded for all Nasdaq-listed securities within a given period. High volume during a price surge or drop suggests conviction behind the move, making it potentially more significant. Low volume, on the other hand, might indicate that a price movement is less robust or simply due to a lack of participation.
Market breadth refers to the number of advancing stocks versus declining stocks. If the Nasdaq Composite is up significantly, but only a handful of large-cap tech stocks are responsible for the gain while the majority of smaller stocks are down, this indicates poor market breadth. This could suggest a less healthy overall market trend, relying too heavily on a few giants. Conversely, broad participation across many stocks during an up day signals greater underlying strength. These metrics provide a more nuanced picture than just the index level itself, helping investors understand the quality and sustainability of the Nasdaq’s current standing.
Factors Influencing Nasdaq’s Daily Fluctuations
The dynamic nature of the Nasdaq Composite means its level is in constant flux, influenced by a complex interplay of domestic and international factors. For those monitoring “what the Nasdaq is at” with an investment lens, recognizing these influences is key to anticipating potential shifts.
Economic Indicators and Monetary Policy
Macroeconomic data provides a fundamental backdrop for the Nasdaq’s performance. Reports on inflation (CPI, PPI), employment (jobless claims, non-farm payrolls), GDP growth, and consumer confidence can significantly sway market sentiment. Strong economic data might suggest robust consumer spending and corporate profits, often boosting investor confidence. However, if strong growth is coupled with rising inflation, it could prompt fears of interest rate hikes from the Federal Reserve, which can be a headwind for growth stocks.
Monetary policy, particularly interest rate decisions by central banks like the U.S. Federal Reserve, holds immense power over the Nasdaq. As mentioned, lower rates tend to be favorable for growth-oriented tech companies, making future earnings more valuable and financing cheaper. When the Fed signals or executes interest rate increases, it can lead to a re-evaluation of high-growth stocks, often resulting in pullbacks on the Nasdaq as investors seek less risky, yield-bearing assets. The “Fed pivot” or “hawkish” versus “dovish” stance is constantly scrutinized by the market.
Corporate Earnings and Sector-Specific News
While macroeconomic factors set the stage, specific corporate developments often drive day-to-day volatility on the Nasdaq. Earnings reports, including revenue, profit, and future guidance, are critical events. A surprise beat or miss by a major tech company can have a ripple effect across the entire index, especially if that company’s performance is seen as a bellwether for the sector. Analyst ratings, mergers and acquisitions (M&A) announcements, product launches, regulatory scrutiny (e.g., antitrust cases against tech giants), and even cybersecurity breaches can cause significant stock price movements for individual companies, which then aggregate to influence the overall Nasdaq Composite. Given the index’s concentration in tech, any news pertaining to semiconductors, artificial intelligence, cloud computing, or e-commerce can have an outsized impact.
Geopolitical Events and Market Sentiment
Beyond the economic and corporate realms, global events and the collective mood of investors play a crucial role. Geopolitical tensions, such as trade disputes, military conflicts, or major political instabilities in key regions, can introduce uncertainty and lead to risk aversion, causing investors to pull money out of equities, particularly growth stocks. Pandemics, natural disasters, or significant changes in international relations can also create widespread market jitters.
Ultimately, market sentiment, often described as “fear and greed,” is an amorphous but powerful driver. Investor confidence, fueled by a positive outlook, can lead to buying frenzies. Conversely, widespread fear or panic, perhaps triggered by a negative news cycle or a major economic downturn, can lead to aggressive selling. Social media and financial news outlets can amplify these sentiments, contributing to rapid and sometimes irrational market movements. Understanding “what the Nasdaq is at” therefore requires an awareness of both quantifiable data and the more qualitative, psychological factors at play.
Investing in the Nasdaq: Approaches and Considerations
For individuals looking to align their personal finance and investment strategies with the growth potential of the Nasdaq, understanding its current standing is just the starting point. There are various ways to gain exposure, each with its own set of risks and rewards.
Direct Stock Ownership vs. Index Funds/ETFs
One approach is to directly invest in individual stocks listed on the Nasdaq, such as buying shares of Apple, Microsoft, or Nvidia. This allows for highly targeted investment in companies believed to have superior growth prospects. However, it requires significant research, carries higher individual company risk, and necessitates active portfolio management. A single poor performance by one company can disproportionately impact one’s portfolio.
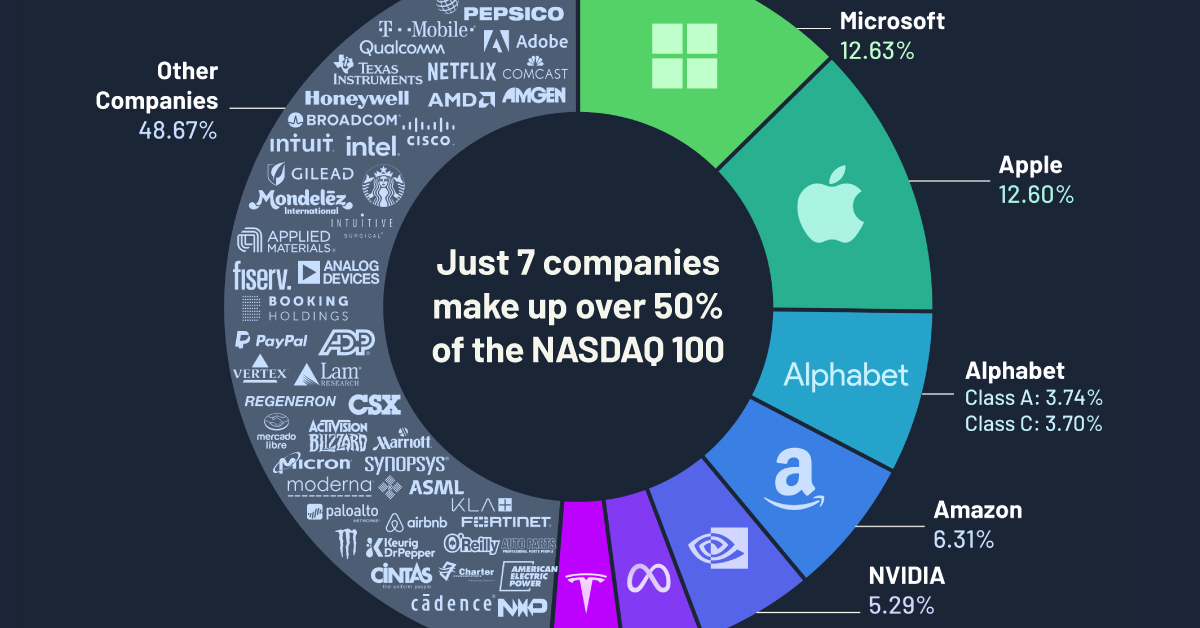
A more diversified and often recommended approach for most investors is to invest in Nasdaq-tracking index funds or Exchange Traded Funds (ETFs). These funds hold a basket of stocks that mirrors the composition and weighting of the Nasdaq Composite (or specific sub-indices like the Nasdaq 100, which tracks the 100 largest non-financial companies on the Nasdaq). This provides instant diversification, reduces individual stock risk, and often comes with lower fees compared to actively managed funds. Examples include ETFs like QQQ (tracking the Nasdaq 100). Investing in such funds means an investor’s performance will broadly track “what the Nasdaq is at” – if the index goes up, their investment generally goes up, and vice versa.
Risk Management in a Volatile Market
The Nasdaq, particularly due to its tech-heavy nature, can be more volatile than broader market indices like the S&P 500 or the Dow Jones. Growth stocks often experience larger price swings in response to news, economic data, or shifts in investor sentiment. Therefore, effective risk management is crucial. This includes diversifying one’s portfolio beyond just Nasdaq-listed tech stocks, perhaps by including value stocks, bonds, or international equities. Setting stop-loss orders, avoiding over-concentration in a few stocks, and only investing capital one can afford to lose are fundamental principles. Understanding “what the Nasdaq is at” in the context of its inherent volatility helps in setting realistic expectations and preparing for potential drawdowns.
Long-term Perspective vs. Short-term Speculation
For the vast majority of personal finance investors, a long-term perspective is advisable when investing in the Nasdaq. Historically, despite periods of significant downturns (e.g., the dot-com bubble burst in 2000, the 2008 financial crisis, or the 2022 tech correction), the Nasdaq Composite has delivered substantial returns over extended periods, reflecting the innovation and growth inherent in the tech sector. DCA (Dollar-Cost Averaging), which involves investing a fixed amount regularly regardless of market fluctuations, can be an effective strategy for long-term growth.
Short-term speculation, attempting to time the market by buying low and selling high based on daily movements of “what the Nasdaq is at,” is extremely challenging and often leads to losses for individual investors. It requires sophisticated analysis, swift execution, and a high tolerance for risk. While some professional traders engage in this, it’s generally not recommended for those building long-term wealth or managing their personal finances.
The Nasdaq’s Role in the Broader Economic Landscape
Beyond its function as an investment vehicle, the Nasdaq Composite plays a significant role in the broader economy, serving as a bellwether and an engine of progress. Its movements are often seen as indicative of current and future economic trends.
A Barometer for Innovation and Growth
Given its heavy concentration of technology and growth companies, the Nasdaq Composite is arguably the best stock market index for gauging the health and pace of innovation. When the Nasdaq is performing well, it often signals a period of rapid technological advancement, robust venture capital funding, and strong investor confidence in future-oriented industries. It reflects the market’s belief in companies pushing boundaries in AI, biotechnology, cloud computing, renewable energy, and more. Therefore, “what the Nasdaq is at” can be interpreted as a reflection of the global appetite for cutting-edge solutions and a proxy for the innovation economy.

Impact on Investor Confidence and Wealth Creation
The Nasdaq’s performance has a tangible impact on investor confidence and household wealth. When the Nasdaq is surging, it creates a “wealth effect,” where investors feel richer, which can lead to increased consumer spending and further economic growth. Conversely, significant downturns can erode confidence, leading to reduced spending and a more cautious economic outlook. Many retirement accounts, mutual funds, and ETFs have significant exposure to Nasdaq-listed companies, meaning the index’s performance directly affects the financial well-being of millions of individuals. Understanding its current standing is therefore not just an academic exercise but a practical necessity for anyone building and managing wealth.
In conclusion, “what is the Nasdaq at?” is a multifaceted question whose answer provides a real-time pulse on the technology sector, the broader stock market, and often, the direction of economic innovation. It’s a number that encapsulates countless data points, market sentiments, and global events. For investors, it’s a critical piece of information guiding strategies for growth and risk management. For the economy at large, it’s a dynamic indicator of progress, confidence, and the relentless pursuit of what’s next. Staying informed about the Nasdaq’s movements and the underlying forces driving them is indispensable for navigating the modern financial landscape.
aViewFromTheCave is a participant in the Amazon Services LLC Associates Program, an affiliate advertising program designed to provide a means for sites to earn advertising fees by advertising and linking to Amazon.com. Amazon, the Amazon logo, AmazonSupply, and the AmazonSupply logo are trademarks of Amazon.com, Inc. or its affiliates. As an Amazon Associate we earn affiliate commissions from qualifying purchases.