The QT interval, a crucial measurement derived from an electrocardiogram (ECG or EKG), represents the duration of ventricular depolarization and repolarization. In simpler terms, it’s the time it takes for the ventricles of the heart to electrically contract and then recover. Understanding the normal length of this interval, as well as the implications of deviations from the norm, is vital in cardiology for assessing cardiac electrical stability and identifying individuals at risk for potentially life-threatening arrhythmias. While the concept might seem technical, its significance extends to diagnostic tools, therapeutic interventions, and even the development of sophisticated algorithms within the realm of medical technology.
The interpretation and measurement of the QT interval are not static. It is influenced by several factors, most notably heart rate. Therefore, a simple fixed number does not define a “normal” QT interval. Instead, cardiologists and the technology that aids them rely on a corrected QT interval (QTc) to account for these variations. This correction, while seemingly a minor adjustment, is fundamental to accurate assessment and the effective utilization of diagnostic technologies.
Understanding the Foundations: The ECG and Cardiac Electrophysiology
Before delving into the specifics of QT interval length, it’s essential to grasp the fundamental electrical activity of the heart that the ECG captures. The heart’s rhythmic beating is orchestrated by a complex electrical system that initiates, conducts, and coordinates the contraction of its chambers.
The Electrical Symphony: Depolarization and Repolarization
The cardiac cycle is a continuous process of electrical activation and recovery.
Depolarization: The Electrical Charge
Depolarization is the process by which cardiac cells become electrically excited. This is triggered by the influx of positively charged ions (primarily sodium and calcium) into the cell, reversing its electrical potential. In the ventricles, this wave of depolarization spreads rapidly, causing the muscle fibers to contract and pump blood out to the body. On an ECG, the QRS complex visually represents ventricular depolarization.
Repolarization: The Electrical Reset
Following contraction, the cardiac cells must electrically reset themselves to be ready for the next beat. This process is called repolarization, where ions move out of the cell, restoring the negative resting potential. Ventricular repolarization is a more prolonged process than depolarization and is represented by the T wave on the ECG. The QT interval encompasses both the entire duration of ventricular depolarization and the subsequent repolarization.
The ECG as a Diagnostic Window
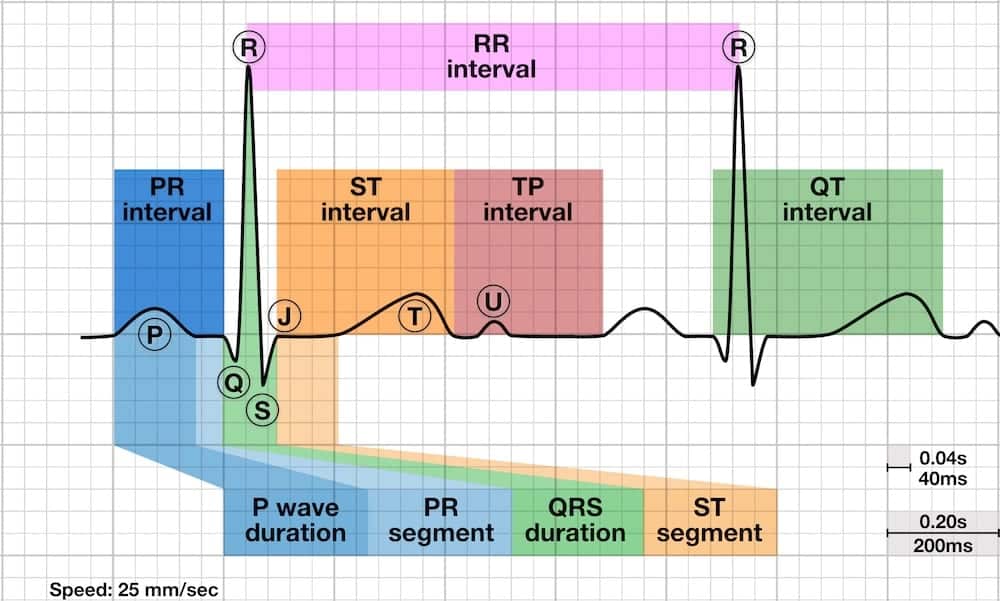
The electrocardiogram is a non-invasive tool that records the electrical activity of the heart over time. Electrodes placed on the skin detect these electrical signals, which are then amplified and displayed as a waveform. This waveform provides invaluable insights into the heart’s rhythm, rate, and the health of its electrical conduction system. Analyzing the various components of the ECG, including the P wave, QRS complex, T wave, and the intervals between them, allows medical professionals to diagnose a wide range of cardiac conditions. The QT interval is one of the most critical measurements derived from this waveform.
The Nuances of QT Interval Measurement and Correction
Determining the “length” of the QT interval is not as straightforward as measuring a fixed duration. Several factors influence it, necessitating a standardized approach to ensure accurate interpretation, especially within the context of advanced diagnostic technologies.
Measuring the QT Interval: From Peak to Trough
The QT interval is measured from the beginning of the QRS complex (representing the onset of ventricular depolarization) to the end of the T wave (representing the completion of ventricular repolarization). The end of the T wave is typically identified as the point where the wave returns to the baseline or, more precisely, the tangent of the steepest downslope of the T wave intersects the isoelectric line. This measurement is performed for each cardiac cycle.
The Heart Rate Dependency: A Critical Consideration
One of the most significant factors influencing the QT interval is heart rate. When the heart beats faster (higher heart rate), the QT interval naturally shortens. Conversely, at slower heart rates, the QT interval lengthens. This inherent dependency makes a raw QT measurement less useful for comparison across individuals or even within the same individual at different heart rates.
The Quest for Normalcy: Introducing the Corrected QT Interval (QTc)
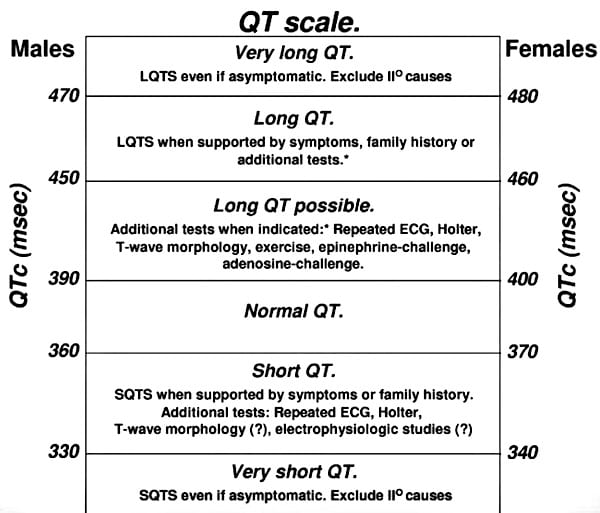
To overcome the heart rate dependency, the concept of the corrected QT interval (QTc) was developed. The QTc aims to provide a standardized QT interval value that reflects what the QT interval would be at a specific reference heart rate, typically 60 beats per minute (bpm). This allows for more reliable comparisons and assessments of cardiac electrical stability.
Several formulas have been developed to calculate the QTc, with Bazett’s formula being one of the most widely used, though often criticized for its accuracy at very high or low heart rates. Other formulas, such as Fridericia’s and Hodges’ formulas, have been developed to address some of Bazett’s limitations and are often employed in contemporary medical devices and software.
Bazett’s Formula:
$QTc = QT / sqrt{RR}$ (where RR is the interval between consecutive R waves in seconds)
Fridericia’s Formula:
$QTc = QT / (RR)^{1/3}$
Hodges’ Formula:
$QTc = QT + 0.00175 times (60 – HR)$ (where HR is heart rate in bpm)
The continuous refinement and development of these correction formulas highlight the ongoing efforts within the tech-driven medical field to enhance the precision and diagnostic power of ECG analysis.
Technological Advancements in QT Interval Analysis
The role of technology in the measurement and interpretation of the QT interval has expanded dramatically, moving beyond manual interpretation to sophisticated automated systems.
Automated ECG Analysis and Interpretation Software
Modern ECG machines and monitoring systems employ advanced algorithms to automatically detect and measure the QT interval. These systems are capable of analyzing continuous ECG data from Holter monitors, event recorders, and even wearable devices. The software identifies the QRS complexes and T waves with remarkable accuracy, calculates the QT interval, and then applies various QTc formulas. This automation significantly reduces the risk of human error and allows for more efficient review of large volumes of cardiac data.
Artificial Intelligence and Machine Learning in QT Monitoring
The integration of Artificial Intelligence (AI) and Machine Learning (ML) is revolutionizing QT interval analysis. AI-powered algorithms can be trained on vast datasets of ECGs to identify subtle patterns and abnormalities that might be missed by traditional methods or even experienced cardiologists.
Predictive Analytics for Arrhythmia Risk
AI models are being developed to predict an individual’s risk of developing QT prolongation-related arrhythmias, such as Torsades de Pointes. By analyzing not only the QT interval but also other ECG parameters, patient demographics, medication history, and genetic predispositions, these systems can provide a more comprehensive risk stratification. This proactive approach allows for earlier intervention and personalized patient management, a significant leap forward in cardiac care.
Real-time QT Monitoring and Alerts
Wearable devices and implantable cardiac monitors are increasingly incorporating sophisticated QT monitoring capabilities. These devices can continuously track the QT interval and generate real-time alerts to both the patient and their healthcare provider if dangerous levels of prolongation are detected. This continuous, proactive monitoring is particularly valuable for individuals with known risk factors or those taking medications that can affect the QT interval.

Challenges and Future Directions in QT Technology
Despite the advancements, challenges remain. The accuracy of automated QT measurements can still be affected by ECG signal quality, artifact, and certain cardiac conditions that distort the T wave. Furthermore, the interpretation of QTc values requires clinical context.
Future directions in QT interval technology are likely to focus on:
- Enhanced Algorithm Robustness: Developing AI algorithms that are even more resilient to noise and artifacts, and capable of accurately measuring QT in complex arrhythmias.
- Personalized QTc Formulas: Exploring the possibility of creating individualized QTc correction formulas based on a patient’s specific physiological characteristics.
- Integration with Other Data Streams: Combining QT interval data with other sources of physiological information (e.g., blood pressure, activity levels) for a more holistic assessment of cardiac health.
- Standardization of Measurement Techniques: Further efforts to standardize how QT intervals are measured and corrected across different devices and platforms to ensure consistency in diagnostic reporting.
The evolution of QT interval measurement, from manual caliper estimations to sophisticated AI-driven predictive analytics, underscores the profound impact of technology on our ability to understand and manage cardiac electrical health. This ongoing innovation promises to enhance diagnostic accuracy, improve patient safety, and pave the way for more personalized and proactive cardiac care.
aViewFromTheCave is a participant in the Amazon Services LLC Associates Program, an affiliate advertising program designed to provide a means for sites to earn advertising fees by advertising and linking to Amazon.com. Amazon, the Amazon logo, AmazonSupply, and the AmazonSupply logo are trademarks of Amazon.com, Inc. or its affiliates. As an Amazon Associate we earn affiliate commissions from qualifying purchases.