The Dow Jones Industrial Average (DJIA) is perhaps the most recognized financial shorthand in the world. When news anchors report that “the market is up,” they are almost always referring to the Dow. For over a century, this index has served as the heartbeat of the American economy, tracking 30 of the most significant blue-chip companies traded on the New York Stock Exchange (NYSE) and the Nasdaq. In recent years, investors have witnessed a historic ascent, with the Dow smashing through psychological barriers that once seemed unreachable.

As of mid-2024, the Dow Jones Industrial Average reached a monumental milestone, surpassing the 40,000-point mark for the first time in history. This peak represents more than just a number; it is a reflection of corporate resilience, monetary policy shifts, and the evolving landscape of global finance. To understand the highest the Dow has ever been is to understand the current state of wealth building and the structural forces driving the modern economy.
Understanding the Milestone: The Dow Jones at Its All-Time High
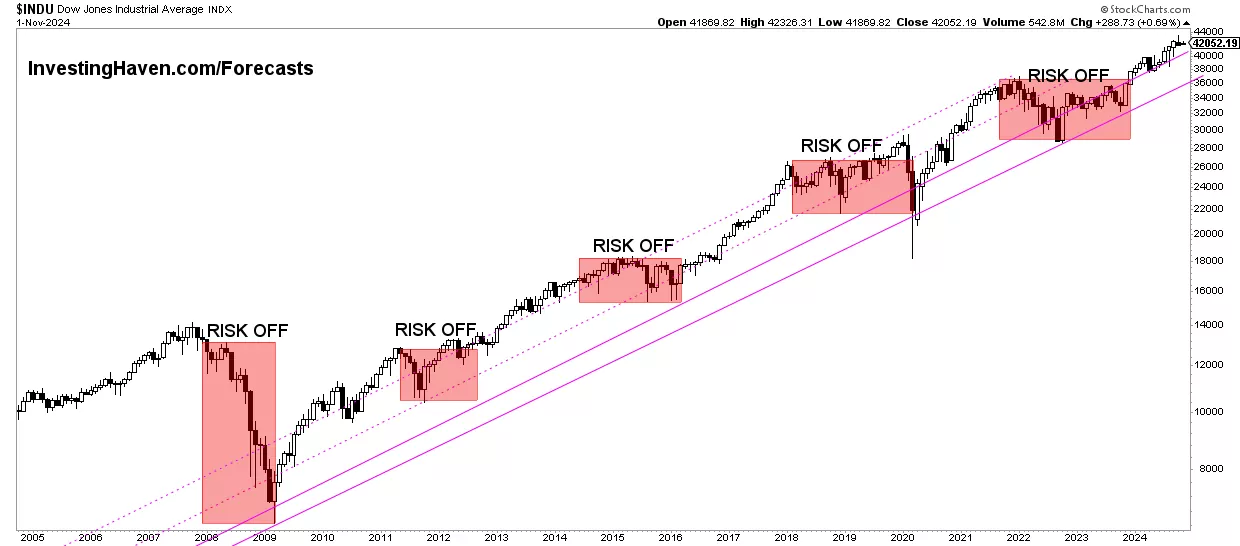
To answer the question of how high the Dow has gone, one must look at the trajectory of 2024. After a period of volatility driven by post-pandemic inflation and rising interest rates, the index found its footing, eventually climbing to an intraday high of over 41,000 in the third quarter of 2024. This record-breaking performance caught many analysts by surprise, especially given the aggressive “higher for longer” interest rate stance maintained by the Federal Reserve for much of the previous year.
Breaking the 40,000 Barrier: A Historical Context
The journey from 30,000 to 40,000 was a rollercoaster. The Dow first crossed the 30,000 threshold in late 2020, fueled by optimism over COVID-19 vaccines and massive government stimulus. However, the subsequent years were defined by a struggle against inflation. Reaching the 40,000 mark required a unique “Goldilocks” environment: an economy that was cooling enough to suggest future rate cuts, yet strong enough to avoid a recession. When the Dow finally hit 40,000 in May 2024, it signaled that investors had regained confidence in the long-term earnings potential of America’s industrial and financial giants.
The Components Driving the Surge
Unlike the S&P 500 or the Nasdaq 100, which are market-cap weighted, the Dow is price-weighted. This means that companies with higher stock prices have a larger influence on the index’s movement, regardless of their total market valuation. During the recent peak, stocks like UnitedHealth Group, Goldman Sachs, and Microsoft played outsized roles in pushing the average to its all-time high. The performance of these heavyweights, particularly in the healthcare and financial sectors, provided the necessary momentum to offset laggards in the retail or energy sectors.
Price-Weighted Indexing: How the Calculation Works
Because the Dow is a price-weighted index, a $5 move in a stock priced at $500 has the same impact as a $5 move in a stock priced at $50. This quirk of history makes the Dow a unique barometer. Critics argue it is less “accurate” than the S&P 500, but its focus on established, profitable leaders makes it a favorite for “old school” value investors. The recent highs were achieved not just because of a few tech outliers, but because of broad-based strength across the 30 diverse companies that comprise the index.
Historical Context: The Long Road to Record Territory
Looking at the highest the Dow has ever been requires looking back at where it started. When Charles Dow created the index in 1896, it consisted of just 12 companies and sat at a level of 40.94 points. The journey to 40,000+ has been marked by era-defining bull markets and devastating crashes, each shaping the way we approach personal finance today.
Post-Pandemic Recovery and the 30,000 Milestone
The 2020s began with one of the sharpest declines in market history, followed by one of the fastest recoveries. The Dow’s climb to 30,000 in November 2020 was a testament to the power of liquidity. Central banks around the world flooded the markets with cash to prevent a total economic collapse. For investors, this period emphasized a crucial lesson: the stock market is a forward-looking mechanism. Even when the “present” looked bleak, the Dow reached new highs because investors were pricing in a future of recovery and digital transformation.
Comparing Today’s Highs to Past Bull Markets
To put the current all-time high into perspective, we must compare it to the “Roaring Twenties” or the “Dot-com Bubble” of the late 90s. In 1929, the Dow peaked at 381 before the Great Depression began. It didn’t return to that level for 25 years. In contrast, the modern Dow has shown incredible elasticity. While the nominal value (the raw number) is at an all-time high, some economists argue that when adjusted for inflation, the current peaks are impressive but not as “expensive” as the peaks seen in 1999, suggesting that there may still be room for growth based on actual corporate earnings.
The Impact of Inflation on Nominal vs. Real Highs
In the world of personal finance, it is vital to distinguish between nominal returns and real returns. While the Dow hitting 40,000 is a headline-grabbing nominal high, the purchasing power of those points is different than it was a decade ago. However, even when adjusted for the high inflation seen in 2022 and 2023, the Dow’s recent performance remains near record territory in “real” terms. This indicates that the companies within the Dow have been successful in passing costs on to consumers and maintaining profit margins—a key trait of high-quality blue-chip stocks.
Catalysts Behind the Current Peak

A market doesn’t reach an all-time high by accident. The Dow’s recent record-breaking run was fueled by a confluence of fundamental and macroeconomic factors that aligned to create a favorable environment for equities.
Corporate Earnings and Fundamental Growth
At the end of the day, stock prices follow earnings. The record highs in the Dow were supported by robust quarterly reports. Despite fears of a consumer slowdown, American corporations showed remarkable efficiency. Through cost-cutting, the integration of AI-driven productivity tools, and strong pricing power, companies like Salesforce and Home Depot managed to grow their bottom lines. These earnings reports provided the “fundamental floor” that allowed the Dow to climb without becoming a purely speculative bubble.
Monetary Policy and Interest Rate Expectations
The Federal Reserve is the “invisible hand” behind the Dow’s movements. After a series of aggressive rate hikes to combat inflation, the market began to price in “the pivot”—the moment when the Fed would stop hiking and begin cutting rates. Low interest rates are generally good for stocks because they lower the cost of borrowing for companies and make the future cash flows of those companies more valuable in today’s dollars. The anticipation of a more accommodative Fed was a primary “jet fuel” for the Dow’s ascent to 40,000 and beyond.
The Tech Influence within the Industrial Average
While the Nasdaq is the traditional home of technology, the Dow has evolved. The inclusion of Apple, Microsoft, and Amazon (which replaced Walgreens in early 2024) has shifted the Dow’s DNA. The “Industrial” in Dow Jones Industrial Average is now more of a legacy term; the index is now heavily influenced by software, cloud computing, and e-commerce. The massive capital inflows into anything related to Artificial Intelligence (AI) helped lift these Dow components, contributing significantly to the record-breaking levels seen this year.
What Record Highs Mean for Your Personal Finance Strategy
For the individual investor, seeing the Dow at its highest point in history can be a double-edged sword. On one hand, it’s a sign of a healthy portfolio; on the other, it triggers the fear that “the top is in” and a crash is imminent. Managing your money during record highs requires a disciplined approach that prioritizes long-term goals over short-term headlines.
The Psychological Trap of “Waiting for a Dip”
One of the most common mistakes in personal finance is sitting on the sidelines when the market hits an all-time high, waiting for a “better entry point.” History shows that the market spends a significant amount of time at or near record highs during bull markets. If you had stopped investing every time the Dow hit a record in the 2010s, you would have missed out on one of the greatest periods of wealth creation in history. Time in the market is almost always more important than timing the market.
Portfolio Rebalancing in a Peak Market
When the Dow is at an all-time high, your asset allocation may have shifted. If you started with a 60/40 split between stocks and bonds, the stock surge might have pushed you to 70/30. Record-high territory is an excellent time to rebalance. By selling some of your winners (the stocks that pushed the Dow to its high) and moving that money into underperforming or more stable assets, you effectively “lock in” gains and maintain your desired risk profile.
Risk Management and Diversification Beyond the Dow
While the Dow’s 40,000+ level is impressive, it only represents 30 companies. A sound financial strategy involves looking beyond the Dow. Are small-cap stocks participating in the rally? How is the international market performing? Highs in the Dow should be a prompt to check your diversification. Relying solely on the 30 giants of the Dow can expose you to concentration risk, especially if a few high-priced stocks in the index begin to falter.
Looking Forward: Can the Momentum Sustain Itself?
As we reflect on the highest the Dow has ever been, the question naturally shifts to the future. Market milestones are often followed by periods of consolidation, where the market “breathes” before its next move.
Economic Indicators to Watch
To sustain these record levels, several things must happen. First, the “labor market” must remain resilient without becoming so hot that it reignites inflation. Second, the “yield curve”—the difference between short-term and long-term interest rates—needs to normalize. Investors are closely watching these indicators to see if the Dow’s high is a sustainable plateau or a temporary peak before a cyclical downturn.
The Role of Global Geopolitics
The Dow is composed of multinational corporations that derive a large portion of their revenue from overseas. Therefore, the highest levels of the Dow are sensitive to global stability. Trade relations with China, energy prices influenced by Middle Eastern stability, and European economic growth all play a role in whether the Dow can move from 40,000 toward the 50,000 mark.
Long-term Investing vs. Market Timing
The most important takeaway for any investor regarding the Dow’s all-time high is the power of compounding. The “highest the Dow has been” will, in all likelihood, be eclipsed again in the years to come. For those focused on retirement, education savings, or general wealth building, the record highs are a reminder that the trajectory of the American economy has historically been upward. Rather than fearing the high, investors should view it as a benchmark of progress, remaining committed to their diversified, long-term financial plans regardless of the daily fluctuations of the 30-stock average.
aViewFromTheCave is a participant in the Amazon Services LLC Associates Program, an affiliate advertising program designed to provide a means for sites to earn advertising fees by advertising and linking to Amazon.com. Amazon, the Amazon logo, AmazonSupply, and the AmazonSupply logo are trademarks of Amazon.com, Inc. or its affiliates. As an Amazon Associate we earn affiliate commissions from qualifying purchases.