
The Dow Jones Industrial Average (DJIA), often simply called “the Dow,” stands as one of the most venerable and widely cited stock market indices in the world. Far more than just a number on a screen, the DJIA serves as a potent barometer for the health of the U.S. economy and the broader market sentiment. For investors, financial analysts, and even the general public, understanding “what is the DJIA now” isn’t merely about knowing its current value; it’s about grasping the underlying forces, historical context, and future implications that such a number represents. This article delves into the intricacies of the Dow, providing a comprehensive guide for anyone looking to interpret its movements and leverage its insights in their financial journey.

Decoding the Dow Jones Industrial Average: A Foundation
To truly appreciate the significance of the DJIA’s current value, one must first understand its origins, construction, and the philosophy behind its composition. It’s a journey from the telegraph to algorithmic trading, but its fundamental role as a snapshot of industrial America, albeit evolved, remains.
The Genesis and Evolution of an Icon
Created by Charles Dow, editor of The Wall Street Journal and co-founder of Dow Jones & Company, the index was first published on May 26, 1896. Initially, it comprised just 12 industrial companies, ranging from American Cotton Oil to U.S. Leather. Its purpose was revolutionary for its time: to provide a simple, understandable gauge of the stock market’s overall direction. In an era before complex economic indicators and real-time data, the Dow offered a crucial daily insight into the nation’s burgeoning industrial might.
Over the decades, the DJIA expanded, first to 20 stocks and then to its current 30 components in 1928. While its name still includes “Industrial,” the index has long transcended purely manufacturing firms. Today’s Dow includes companies from diverse sectors such as technology, healthcare, finance, and retail, reflecting the evolving landscape of the American economy. Companies like Apple, Microsoft, UnitedHealth Group, and Goldman Sachs now stand alongside industrial giants like Boeing, illustrating a conscious effort to keep the index relevant and representative of modern economic drivers. This constant evolution ensures that when we ask “what is the DJIA now,” we are inquiring about a truly contemporary cross-section of leading U.S. enterprises.
How the Dow is Calculated: More Than Just an Average
Despite its name, the DJIA is not a simple arithmetic average of its component stock prices. It is a price-weighted index, which means stocks with higher prices have a greater influence on the index’s value than those with lower prices. This methodology contrasts with market-capitalization-weighted indices (like the S&P 500), where companies with larger total market value exert more influence.
The calculation involves summing the prices of the 30 component stocks and then dividing that sum by a “Dow Divisor.” This divisor is a dynamic number, adjusted for stock splits, dividends, and other structural changes to the component companies, ensuring the continuity and comparability of the index over time. If a stock splits, its price goes down, which would artificially lower the index. The divisor is adjusted downwards to counteract this effect, maintaining the index’s integrity. For example, if a stock trading at $100 splits 2-for-1, its new price is $50. Without a divisor adjustment, the Dow would drop significantly. By reducing the divisor, the overall index value remains consistent before and after the split, preventing artificial fluctuations. This unique calculation method is a critical detail that distinguishes the Dow and influences how its movements are perceived.
The “Blue-Chip” Composition: Who Makes the Cut?
The 30 companies that comprise the DJIA are not chosen by a formula but by a committee at S&P Dow Jones Indices. The selection criteria emphasize “blue-chip” companies—large, well-established, and financially sound corporations with a history of stable earnings and consistent growth. They are typically leaders in their respective industries and are expected to represent a significant portion of the economic activity within the United States.
While the “industrial” moniker is largely historical, the committee aims for broad sector representation to ensure the index accurately reflects the health of the overall economy. Changes to the Dow’s composition are infrequent but significant, usually occurring when a company’s market relevance declines, or another company emerges as a more fitting representative of its sector or the broader economy. For instance, the addition of Salesforce in 2020 and the removal of ExxonMobil signaled a shift towards technology and away from traditional energy within the index’s representation of America’s economic engine. These deliberate choices underline the Dow’s aspiration to remain a relevant and insightful snapshot of the market’s leading players.
The DJIA as an Economic Barometer: What Does it Signal?
Beyond its numerical value, the DJIA acts as a crucial barometer for economic health and investor sentiment. Its movements are often scrutinized as indicators of both present conditions and future expectations.
Reflecting Corporate Health and Investor Sentiment
When the DJIA rises consistently, it generally indicates that the 30 blue-chip companies are performing well, reporting strong earnings, and projecting positive future outlooks. This, in turn, often reflects a robust underlying economy, with healthy consumer spending, business investment, and overall confidence. Conversely, a sustained decline in the Dow can signal corporate distress, weaker economic activity, or a general lack of investor confidence due to various concerns, ranging from inflation to geopolitical instability.
The Dow’s daily fluctuations also provide a snapshot of real-time investor sentiment. Positive news—a strong jobs report, better-than-expected corporate earnings, or a breakthrough in a geopolitical issue—can send the Dow soaring as investors become more optimistic. Negative news, such as rising interest rates, inflationary pressures, or global conflicts, can trigger sell-offs as fear and uncertainty grip the market. Therefore, “what is the DJIA now” is not just a static figure but a dynamic reflection of the collective mood of millions of investors and the perceived health of corporate America.
Short-Term Volatility vs. Long-Term Trends
It’s crucial to differentiate between the DJIA’s short-term volatility and its long-term trends. Daily or weekly swings, while often grabbing headlines, might be driven by temporary news cycles, technical trading, or market speculation. These short-term movements, while indicative of immediate sentiment, may not necessarily reflect fundamental shifts in the economy or corporate performance. A single day’s 500-point swing might be largely noise in the grand scheme of things.
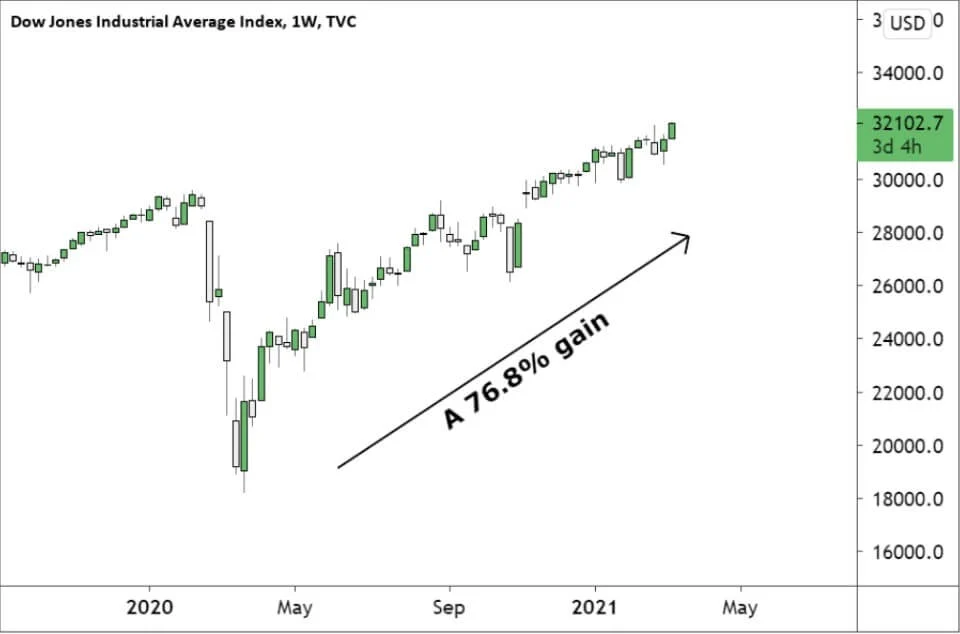
However, sustained upward or downward trends over several months or years often signal more fundamental changes. A prolonged bull market (rising Dow) typically corresponds with economic expansion, innovation, and improving corporate profits. A protracted bear market (falling Dow) can align with recessions, economic contractions, or significant structural challenges. Understanding the difference between fleeting market noise and enduring trends is key for investors seeking to make informed decisions rather than reacting impulsively to every headline. The “now” of the DJIA must always be considered within its broader historical context.
DJIA’s Role in Economic Forecasting
While not a perfect predictor, the DJIA is frequently used as a leading economic indicator. Significant downturns in the Dow have historically preceded recessions, and strong upturns often signal economic recoveries. The stock market, by its very nature, is forward-looking; stock prices often reflect investors’ expectations for future corporate earnings and economic conditions, typically looking 6 to 9 months ahead.
Therefore, financial professionals and policymakers often monitor the DJIA closely for early signs of economic shifts. A sustained rally might suggest that businesses are anticipating increased demand and profitability, leading to more hiring and investment. Conversely, a consistent decline could indicate that companies are bracing for slower growth, reduced consumer spending, and potential job cuts. While no single indicator tells the whole story, the DJIA’s behavior provides valuable input into the complex mosaic of economic forecasting, helping stakeholders gauge the future trajectory of the economy.
Factors Influencing the Dow’s Daily Movements
The DJIA’s value doesn’t change in a vacuum. A multitude of internal and external factors constantly tug at its components, shaping its performance on a daily basis. For those asking “what is the DJIA now,” understanding these drivers is paramount.
Macroeconomic Indicators: Inflation, Employment, GDP
Broad economic data releases significantly impact the Dow. A strong Gross Domestic Product (GDP) report, indicating economic growth, typically boosts investor confidence, while a weak report can trigger concerns. Employment figures, such as the monthly jobs report and unemployment rate, are critical: robust job creation signals a healthy consumer base, while rising unemployment points to economic weakness.
Inflation data, particularly the Consumer Price Index (CPI) and Producer Price Index (PPI), are also closely watched. High inflation erodes purchasing power and corporate profit margins, often leading to central banks raising interest rates, which can dampen economic activity and stock market enthusiasm. Conversely, controlled inflation can be a sign of a robust, growing economy. These macro indicators provide the backdrop against which the DJIA’s daily drama unfolds.
Corporate Earnings and Sectoral Performance
Since the DJIA comprises 30 major companies, their individual financial performance plays a huge role. During earnings season, investors keenly await reports from these blue-chip giants. Strong earnings reports, positive guidance for future quarters, and share buyback announcements can send individual component stocks—and consequently the entire Dow—higher. Conversely, missed earnings expectations, reduced guidance, or negative industry outlooks can weigh heavily on the index.
Moreover, the performance of key sectors represented in the Dow can have a ripple effect. If the technology sector (which includes components like Apple and Microsoft) faces headwinds, or if the financial sector (represented by Goldman Sachs or JPMorgan Chase) experiences stress, their collective impact can pull the overall index down. This interdependency means that a deep dive into the DJIA’s current standing often requires a look at the health of its most influential sectors.
Geopolitical Events and Market Psychology
Beyond pure economic and corporate fundamentals, geopolitical events and broad market psychology exert a significant influence. International conflicts, trade disputes, political instability in major economies, or even domestic policy uncertainty can introduce volatility. These events often trigger a “flight to safety,” where investors pull money out of riskier assets like stocks and into safer havens, causing market indices like the Dow to fall.
Market psychology, characterized by fear, greed, and herd mentality, also plays a crucial role. Positive news can generate optimism, leading to buying frenzies, while negative news can quickly spread panic, triggering widespread selling. Social media and instantaneous news cycles have amplified these psychological effects, making emotional responses a more pronounced factor in daily market movements. Therefore, to understand “what is the DJIA now,” one must also consider the prevailing sentiment and geopolitical climate.
Central Bank Policies and Interest Rates
Central bank policies, most notably those of the U.S. Federal Reserve, are arguably one of the most impactful drivers of the DJIA. Decisions regarding interest rates, quantitative easing (bond buying), or quantitative tightening (reducing bond holdings) directly affect the cost of borrowing for companies and consumers, the attractiveness of alternative investments (like bonds), and the overall liquidity in the financial system.
When interest rates are low, borrowing is cheaper, encouraging businesses to invest and expand, and making stocks more attractive relative to lower-yielding bonds. This typically supports a rising stock market. Conversely, when the Fed raises interest rates to combat inflation, it increases borrowing costs, potentially slowing economic growth and making bonds more appealing, which can put downward pressure on stock valuations. The Fed’s rhetoric and outlook on the economy are often scrutinized intensely by market participants, as they provide critical clues about future monetary policy and its potential impact on the Dow.
Beyond the Number: Interpreting the DJIA for Investors
Knowing the DJIA’s current value is just the first step. The real value for investors lies in understanding how to interpret this number within a broader financial context.
The Importance of Context: Why “Now” Matters
When asking “what is the DJIA now,” the immediate number—say, 38,000 points—is far less important in isolation than its context. Is it up or down today? How has it performed this week, this month, or this year? What’s the trend? A small daily drop after a significant rally might be normal profit-taking, whereas a similar drop during an already declining market could signal deeper issues.
Context also involves understanding the news of the day. Did the DJIA move after an inflation report? Was it influenced by a major tech company’s earnings? Is there a geopolitical event unfolding? By linking the number to the catalysts, investors can better gauge the market’s reaction to current events and avoid drawing misleading conclusions from isolated data points. Furthermore, understanding the “now” means assessing the volatility—is the market experiencing sharp swings or relatively calm movements? This insight helps in managing risk and shaping investment strategies.
Comparing the Dow to Other Major Indices (S&P 500, Nasdaq)
While iconic, the DJIA should not be viewed in isolation. It’s crucial to compare its performance with other major indices, particularly the S&P 500 and the Nasdaq Composite.
- S&P 500: Comprising 500 large-cap U.S. companies and weighted by market capitalization, the S&P 500 is often considered a more comprehensive and accurate representation of the broader U.S. stock market than the DJIA. Its broader base and market-cap weighting offer a different perspective.
- Nasdaq Composite: Heavily weighted towards technology and growth companies, the Nasdaq is a key indicator for the tech sector. Its movements can sometimes diverge significantly from the DJIA or S&P 500, especially during periods when tech stocks are either surging or facing unique challenges.
By comparing the Dow’s performance against these benchmarks, investors gain a more nuanced understanding of market dynamics. For example, if the Dow is up but the Nasdaq is down, it might suggest that traditional industrial and financial stocks are performing well, while tech stocks are struggling, indicating a sector rotation. This comparative analysis provides a more holistic view of “what is the DJIA now” within the broader market tapestry.
Practical Applications for Individual and Institutional Investors
For individual investors, the DJIA serves as a quick reference point for overall market sentiment. While few directly invest in the DJIA itself, exchange-traded funds (ETFs) and mutual funds track the Dow (or a similar basket of large-cap stocks), offering a way to gain exposure to these blue-chip companies. Understanding its movements can help inform decisions about portfolio adjustments, risk assessment, and market timing, though timing the market is notoriously difficult.
Institutional investors, portfolio managers, and financial advisors use the DJIA as part of their comprehensive market analysis. It helps them benchmark performance, identify trends, and communicate market conditions to clients. While they also rely on more granular data and sophisticated models, the Dow’s prominence makes it an essential part of their toolkit for understanding and explaining market shifts. For all investors, the DJIA is a useful shorthand for assessing the health of America’s corporate giants.
The Future Outlook: What to Watch When Tracking the DJIA
The DJIA’s journey is continuous, constantly adapting to new economic realities and technological advancements. Keeping an eye on key trends and potential shifts is vital for interpreting its future movements.
Evolving Economic Landscape and Market Dynamics
The global economy is perpetually in flux, and the DJIA will continue to react to these changes. Investors should monitor shifts in global trade relationships, the strength of emerging markets, and broad economic policies from major world powers. Domestically, ongoing debates about fiscal policy, infrastructure spending, and regulatory changes can influence the operating environment for Dow components. The long-term trajectory of inflation and the corresponding monetary policy responses will also remain critical determinants of the Dow’s health. The “now” of the DJIA is always a prelude to its next phase.
Technological Shifts and Industry Realignments
While the DJIA has broadened its scope beyond traditional “industrials,” technological innovation continues to reshape sectors and create new economic powerhouses. The rise of artificial intelligence, renewable energy, biotechnology, and advanced manufacturing could lead to new dominant players that might eventually find their way into the Dow. Companies that fail to innovate or adapt risk falling out of favor, potentially being replaced in the index by more dynamic firms. Investors should watch for these tectonic shifts in industry leadership, as they dictate which companies will drive future Dow performance.

Strategies for Navigating Dow Fluctuations
Given the inherent volatility and complexity of the stock market, investors tracking the DJIA should adopt a disciplined and long-term perspective. Rather than reacting to every daily swing, focusing on underlying economic fundamentals, corporate earnings trends, and strategic asset allocation is generally more prudent. Diversification beyond just the 30 Dow components, considering a mix of asset classes and geographies, can also help mitigate risk. Financial tools and advisors can assist in crafting strategies tailored to individual risk tolerance and investment goals, helping investors leverage the insights from “what is the DJIA now” to make informed decisions for their financial future.
In conclusion, the question “what is the DJIA now” is an invitation to explore the intricate web of economic forces, corporate performance, and investor sentiment that shapes one of the world’s most iconic financial indicators. By understanding its history, calculation, influencing factors, and contextual interpretation, investors can gain valuable insights into the pulse of the market and make more informed decisions on their journey toward financial prosperity.
aViewFromTheCave is a participant in the Amazon Services LLC Associates Program, an affiliate advertising program designed to provide a means for sites to earn advertising fees by advertising and linking to Amazon.com. Amazon, the Amazon logo, AmazonSupply, and the AmazonSupply logo are trademarks of Amazon.com, Inc. or its affiliates. As an Amazon Associate we earn affiliate commissions from qualifying purchases.