
In the vast and often complex world of finance, understanding key market indicators is crucial for investors, analysts, and anyone looking to gauge the health of the economy. Among the most frequently cited and sometimes conflated are the Dow Jones Industrial Average (DJIA) and the Nasdaq Composite. While both are prominent stock market indices that reflect the performance of publicly traded companies, they represent different slices of the market, are calculated distinctively, and offer unique insights into economic trends. Demystifying their differences is not merely an academic exercise; it’s a fundamental step for anyone seeking to make informed investment decisions or simply comprehend financial news.

This article will delve into the core characteristics of both the Dow Jones and Nasdaq, exploring their historical contexts, methodologies, sectoral concentrations, and what their movements signify for the broader market. By the end, you will have a clear understanding of what sets these two iconic indices apart and how each serves as a valuable, albeit distinct, barometer for the investment landscape.
Understanding Stock Market Indices
Before dissecting the specifics of the Dow Jones and Nasdaq, it’s essential to grasp the fundamental concept of a stock market index. These indices are more than just numbers; they are powerful tools designed to provide a snapshot of market performance, economic health, or specific sector trends.
What is a Stock Market Index?
A stock market index is a hypothetical portfolio of stocks representing a particular market or a segment of it. It serves as a benchmark for the performance of a group of assets, often equities. Indices are created by financial service providers or exchanges and are used for several critical purposes:
- Performance Measurement: They allow investors to track the overall movement of the market or a specific sector without having to analyze every single stock. If an index goes up, it suggests the stocks it represents are generally performing well.
- Economic Barometer: Major indices often correlate with broader economic health. A rising index might signal economic growth and investor confidence, while a falling index could indicate contraction or uncertainty.
- Investment Vehicles: Many financial products, such as Exchange Traded Funds (ETFs) and mutual funds, are designed to mirror the performance of specific indices, allowing investors to gain exposure to a broad market segment with a single investment.
- Benchmarking: Portfolio managers often compare their own investment performance against relevant indices to assess their success.
Why Do We Have Different Indices?
The existence of multiple indices stems from the need to measure different aspects of the market. The global stock market is incredibly diverse, comprising companies of varying sizes, industries, growth stages, and geographical locations. A single index could not possibly capture this complexity. Therefore, different indices are constructed with specific criteria to focus on:
- Market Size (Market Capitalization): Some indices track large-cap companies (like the S&P 500), while others focus on mid-cap or small-cap firms.
- Sector or Industry: There are indices dedicated solely to technology, healthcare, energy, real estate, and other specific sectors.
- Geographical Location: Indices exist for specific countries (e.g., Nikkei 225 for Japan), regions (e.g., Euro Stoxx 50), or even global markets.
- Investment Style: Growth-oriented indices versus value-oriented indices.
The Dow Jones and Nasdaq Composite are prime examples of indices designed with different focuses, reflecting distinct parts of the U.S. equity market.
The Dow Jones Industrial Average (DJIA): An Industrial Barometer
Often simply referred to as “the Dow,” the Dow Jones Industrial Average is one of the oldest, most recognized, and frequently quoted stock market indices in the world. Its history dates back to the late 19th century, making it a venerable symbol of American capitalism.
History and Composition
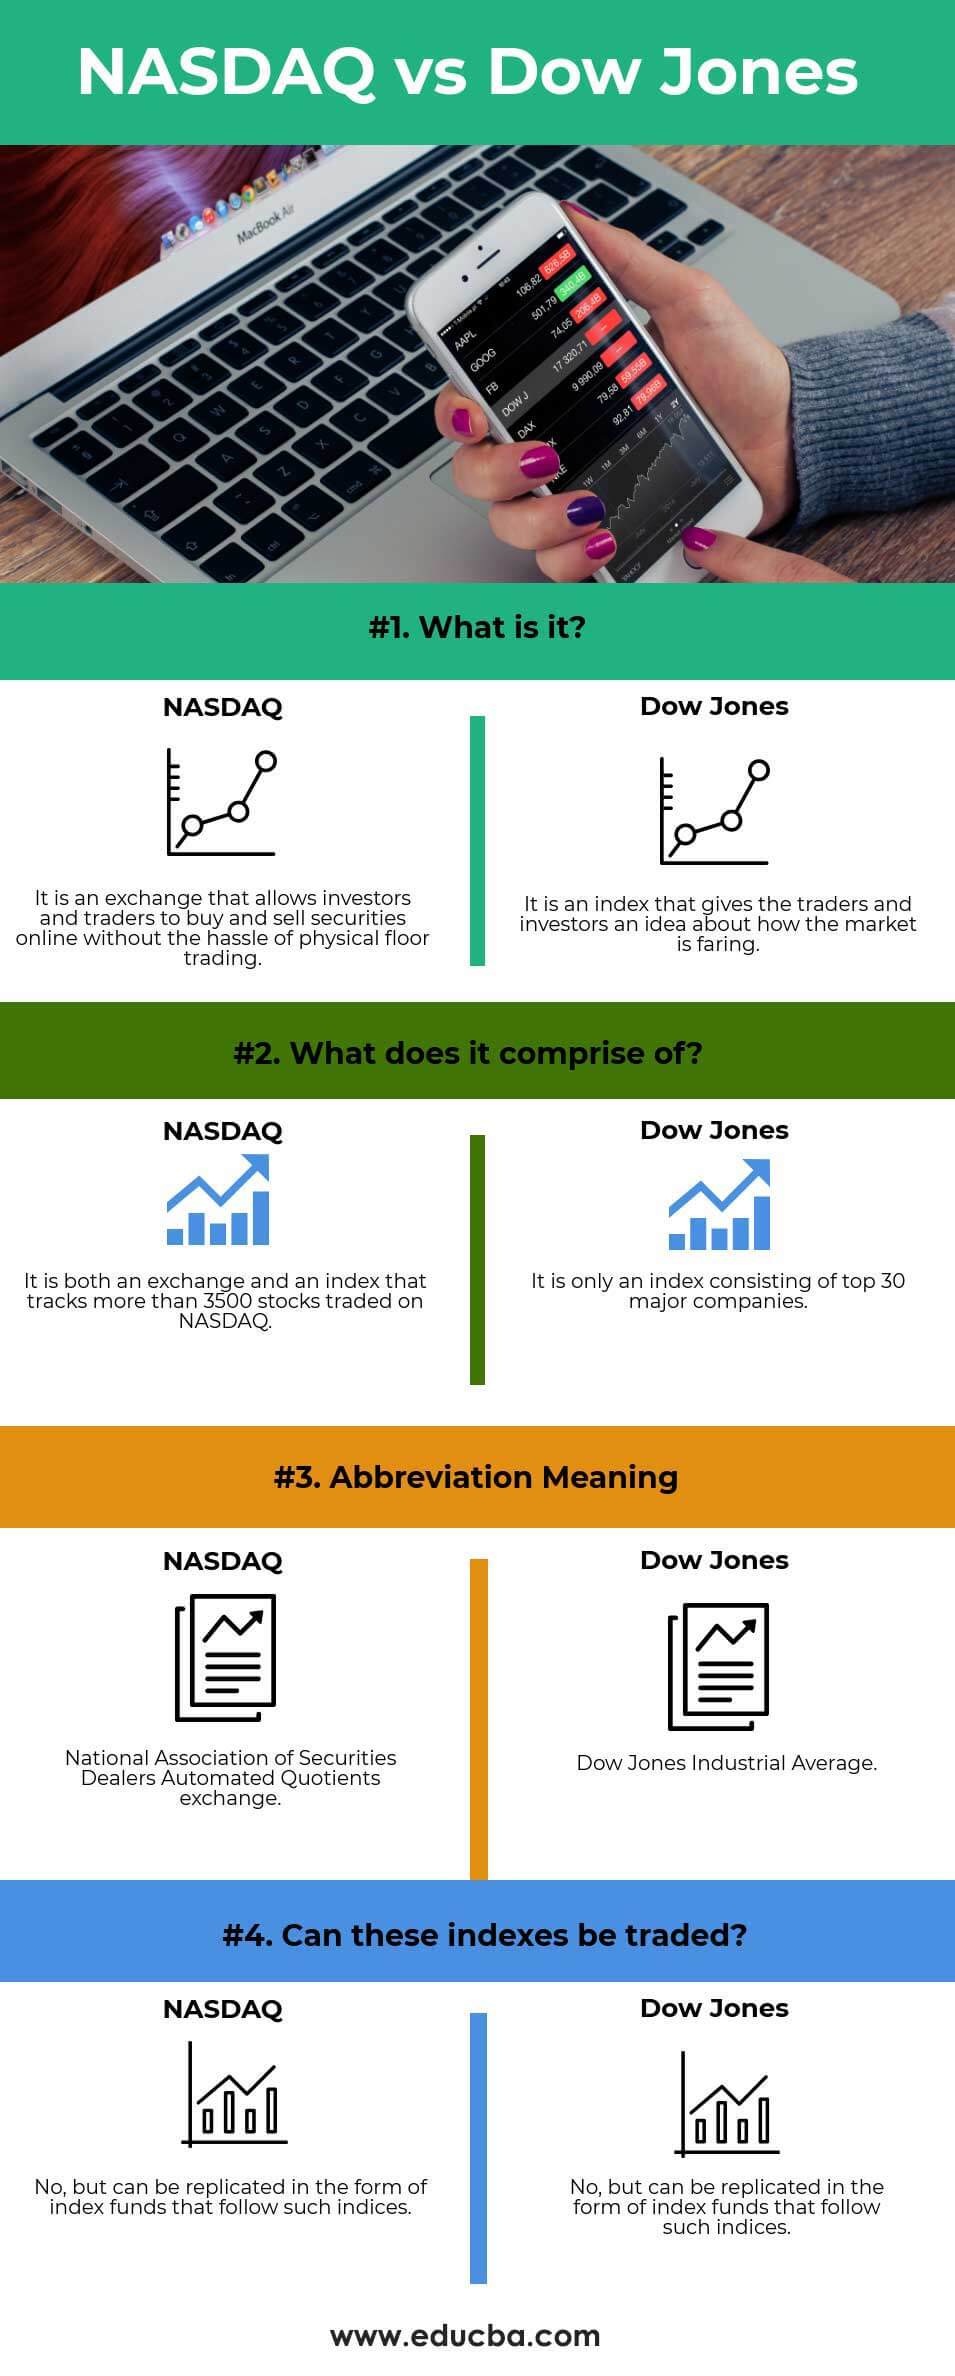
The DJIA was created by Charles Dow, founder of The Wall Street Journal and Dow Jones & Company, in 1896. Initially composed of 12 industrial stocks, it aimed to serve as a proxy for the overall health of the U.S. industrial sector. Today, the DJIA comprises 30 large, publicly owned companies that are considered “blue-chip” stocks. These are typically established, financially sound, and widely respected companies with long histories of stable earnings. While the name retains “Industrial Average,” the composition has evolved significantly over time to reflect the changing nature of the U.S. economy, now including companies from diverse sectors such as technology, finance, retail, and healthcare. Examples of current Dow components include Apple, Microsoft, Goldman Sachs, Johnson & Johnson, and Walmart. The components are selected by a committee, not by strict quantitative rules, and are meant to represent a broad cross-section of the U.S. economy.
Price-Weighted Methodology
One of the most defining characteristics of the DJIA is its calculation methodology: it is a price-weighted index. This means that stocks with higher share prices have a greater impact on the index’s value than stocks with lower share prices, regardless of their company’s overall market capitalization.
To calculate the DJIA, the sum of the prices of its 30 component stocks is divided by a special divisor, known as the “Dow Divisor.” This divisor is adjusted for stock splits, dividends, and changes in the index’s composition to maintain historical continuity.
- Impact: A $1 change in the price of a high-priced stock will have a much larger effect on the index’s value than a $1 change in a low-priced stock, even if the lower-priced company is much larger in terms of market value. This can sometimes lead to a perception that the Dow doesn’t always accurately reflect the broader market, as a single high-priced stock could disproportionately influence its movement.
The “Industrial” Misnomer
As mentioned, the “Industrial” in DJIA is largely a historical relic. While it once accurately reflected the heavy industries of the late 19th and early 20th centuries, the U.S. economy has diversified dramatically. The Dow’s current components include major technology firms, financial institutions, consumer goods giants, and healthcare innovators, reflecting a much broader economic landscape. The selection committee aims to ensure the index remains relevant and representative of major sectors.
Strengths and Criticisms
Strengths:
- Simplicity and Recognition: Its long history and straightforward concept make it widely understood and frequently cited in media.
- Blue-Chip Representation: It tracks established, financially stable companies, often seen as bellwethers of economic stability.
- Historical Significance: Provides a continuous historical record of market performance over more than a century.
Criticisms:
- Limited Scope: With only 30 companies, it offers a relatively narrow view of the vast U.S. stock market.
- Price-Weighting Issues: The price-weighted methodology can be misleading, as a company’s stock price doesn’t necessarily correlate with its economic importance or market value. A small company with a high stock price could have more influence than a large company with a lower stock price.
- Subjective Component Selection: The selection of companies is not based on strict quantitative rules, which some argue makes it less transparent than other indices.
The Nasdaq Composite: A Hub for Growth and Innovation
In contrast to the venerable Dow, the Nasdaq Composite Index is a more modern index, born out of the electronic trading revolution. It has become synonymous with technology and growth companies, particularly those in the innovation space.
History and Composition
The Nasdaq Stock Market itself was founded in 1971 as the world’s first electronic stock market. The Nasdaq Composite Index was created to track the performance of all common equities listed on the Nasdaq stock exchange. Today, it includes over 3,000 stocks, making it a much broader index than the Dow.
Unlike the Dow’s blue-chip focus, the Nasdaq Composite is heavily weighted towards technology and growth-oriented companies. It has been the primary listing venue for many groundbreaking tech firms since its inception, including giants like Apple, Amazon, Microsoft, and Google (Alphabet). While tech companies dominate, the index also includes companies from other sectors, such as biotechnology, telecommunications, and retail, provided they are listed on the Nasdaq exchange.
Market-Capitalization Weighted Methodology
The Nasdaq Composite is a market-capitalization weighted index. This means that companies with larger market capitalizations (share price multiplied by the number of outstanding shares) have a greater influence on the index’s value than companies with smaller market capitalizations.
- Impact: If a large-cap company like Apple sees its stock price rise, it will have a more significant impact on the Nasdaq Composite than an equivalent percentage rise in a smaller company’s stock. This methodology is generally considered to be a more accurate representation of the market’s overall value, as it prioritizes companies with greater economic significance.
Sectoral Focus: Technology and Beyond
While the Nasdaq Composite is widely recognized for its strong concentration of technology companies, it’s important to remember that it’s not exclusively a tech index. Any company that meets Nasdaq’s listing requirements can be included. However, due to its historical appeal to innovative and often growth-stage companies, technology firms have naturally gravitated towards it, making them a dominant force within the index. This concentration means the Nasdaq Composite can be particularly sensitive to trends and investor sentiment within the tech sector.
Strengths and Criticisms
Strengths:
- Broad Representation: With over 3,000 companies, it offers a much broader snapshot of the market, particularly growth-oriented and small-to-mid-cap companies.
- Tech and Innovation Focus: It’s an excellent barometer for the performance of the technology sector and other high-growth industries.
- Market-Cap Weighting: This methodology is generally preferred by financial professionals as it reflects the true economic scale of companies.
Criticisms:
- Volatility: Due to its heavy concentration in growth and technology stocks, which can be more susceptible to investor sentiment and rapid changes, the Nasdaq Composite can be more volatile than broader, more diversified indices.
- Sectoral Concentration Risk: Its strong reliance on technology can mean that a downturn in that specific sector could disproportionately impact the index, even if other parts of the economy are doing well.
- Less Reflective of “Old Economy”: While it includes some non-tech companies, it doesn’t offer a comprehensive view of traditional industrial sectors.
Key Distinctions and Investor Implications
The differences between the Dow Jones Industrial Average and the Nasdaq Composite are significant and carry important implications for how investors interpret market movements and construct their portfolios.
Calculation Methodology: Price-Weighted vs. Market-Cap Weighted
This is perhaps the most fundamental difference.
- Dow Jones (Price-Weighted): Higher-priced stocks have a greater impact, regardless of company size. This can lead to situations where a smaller company with a high stock price moves the index more than a massive company with a lower stock price.
- Nasdaq Composite (Market-Cap Weighted): Larger companies (by total market value) have a greater impact. This method is generally seen as more accurately reflecting the relative economic importance of each company within the index.
Number and Type of Companies
- Dow Jones: Comprises 30 large, established “blue-chip” companies, selected to represent a broad cross-section of the U.S. economy, but with a limited scope.
- Nasdaq Composite: Includes over 3,000 companies listed on the Nasdaq exchange, with a strong emphasis on technology, innovation, and growth-oriented businesses, offering a much broader and often more dynamic view.
Sectoral Representation
- Dow Jones: Represents a more traditional, diversified blend of sectors, including finance, healthcare, consumer goods, and some older industrial names, although technology is increasingly present.
- Nasdaq Composite: Predominantly features companies from the technology, biotechnology, and other high-growth sectors. While not exclusively tech, it is heavily influenced by their performance.
Volatility and Risk Profile
- Dow Jones: Generally considered less volatile than the Nasdaq due to its focus on established, often more stable blue-chip companies. It tends to move more steadily in response to broad economic factors.
- Nasdaq Composite: Tends to be more volatile due to its concentration in growth stocks and technology, which can experience rapid swings in investor sentiment and are often more sensitive to interest rate changes and economic outlooks. This higher potential for growth often comes with higher risk.
What They Tell Us About the Market
- Dow Jones: Offers insights into the performance of large, mature American corporations and can be seen as a proxy for the stability and health of traditional industries. It’s often viewed as a reflection of “old economy” strength, though it has adapted.
- Nasdaq Composite: Provides a robust indicator of the performance of the technology sector and growth-oriented companies, reflecting innovation and future economic trends. It’s a key gauge for the “new economy.”
Investing Through Dow and Nasdaq
Understanding the differences between these indices is not just theoretical; it has practical implications for investors considering how to allocate their capital.
ETFs and Mutual Funds Tracking Each Index
Investors cannot directly invest in an index. Instead, they can gain exposure through financial products designed to track their performance:
- Index Funds and ETFs: Many exchange-traded funds (ETFs) and mutual funds are specifically designed to replicate the performance of either the Dow Jones Industrial Average or the Nasdaq Composite. For example, the SPDR Dow Jones Industrial Average ETF (DIA) tracks the Dow, while the Invesco QQQ Trust (QQQ) tracks the Nasdaq-100 (a subset of the Nasdaq Composite consisting of the 100 largest non-financial companies on the Nasdaq exchange). These vehicles offer a convenient and diversified way to invest in the underlying components of each index.
Strategic Considerations for Investors
- Diversification: An investor looking for exposure to large, established companies across a range of traditional sectors might lean towards a Dow-tracking investment. Conversely, an investor seeking exposure to technology and growth companies would find the Nasdaq Composite more appealing. A balanced portfolio might include exposure to both, achieving diversification across different company types and sectors.
- Risk Tolerance: Investors with a higher risk tolerance and a belief in the continued growth of technology might favor Nasdaq-heavy investments, accepting potentially higher volatility for greater growth potential. Those preferring more stability might favor the Dow.
- Market Outlook: An investor bullish on the broader economy and traditional industries might find the Dow a good gauge, while one with a strong conviction in the innovation economy would focus on the Nasdaq.
Conclusion
The Dow Jones Industrial Average and the Nasdaq Composite are two immensely important, yet fundamentally different, barometers of the U.S. stock market. The Dow, with its storied history and price-weighted calculation of 30 blue-chip companies, offers a view into the stability and performance of large, established corporations across diversified sectors. The Nasdaq Composite, a broader market-capitalization-weighted index of over 3,000 stocks, primarily reflects the dynamism and growth potential of technology and innovative companies.
Understanding these distinctions is crucial for interpreting market news, assessing economic health, and, most importantly, making informed investment decisions. Neither index is inherently “better” than the other; instead, they serve different purposes and provide unique lenses through which to view the intricate world of finance. For investors, recognizing these differences allows for more strategic portfolio construction, aligning investment choices with individual financial goals, risk tolerance, and market outlook. By appreciating what each index represents, one can gain a more nuanced and comprehensive understanding of the forces shaping today’s financial landscape.
aViewFromTheCave is a participant in the Amazon Services LLC Associates Program, an affiliate advertising program designed to provide a means for sites to earn advertising fees by advertising and linking to Amazon.com. Amazon, the Amazon logo, AmazonSupply, and the AmazonSupply logo are trademarks of Amazon.com, Inc. or its affiliates. As an Amazon Associate we earn affiliate commissions from qualifying purchases.