
In the world of investing, the S&P 500 stands as the preeminent benchmark for the health of the United States economy and the global equity market. For investors ranging from retail enthusiasts to institutional fund managers, one metric reigns supreme when assessing whether the market is “cheap” or “expensive”: the Price-to-Earnings (PE) ratio. As of mid-2024, the S&P 500 PE ratio has become a focal point of intense debate, sitting at levels that are historically elevated yet arguably justified by unique macroeconomic conditions. Understanding where this ratio stands today, how it is calculated, and what it signals for future returns is essential for anyone looking to navigate the modern financial landscape.
Understanding the Fundamentals: What the PE Ratio Really Tells Us
The Price-to-Earnings ratio is a valuation multiple that compares a company’s current share price to its per-share earnings. When applied to the S&P 500, it represents the aggregate price of all five hundred constituent companies divided by their aggregate earnings. In simpler terms, it tells an investor how much they are paying for every $1 of the index’s profit.
How the PE Ratio is Calculated
To calculate the PE ratio for the S&P 500, analysts take the total market capitalization of all companies in the index and divide it by the total net income of those same companies. Because the S&P 500 is market-cap weighted, the largest companies—such as Microsoft, Apple, and Nvidia—have a disproportionate impact on the final number. If these mega-cap tech giants trade at high multiples, the entire index’s PE ratio will climb, even if the average “mid-sized” company in the index remains relatively affordable.
The Difference Between Trailing and Forward PE
Investors primarily look at two variations of this metric: the Trailing Twelve Months (TTM) PE and the Forward PE. The TTM PE looks backward at the actual earnings reported over the past year. It is a concrete, objective number, but it can be misleading during periods of rapid economic change.
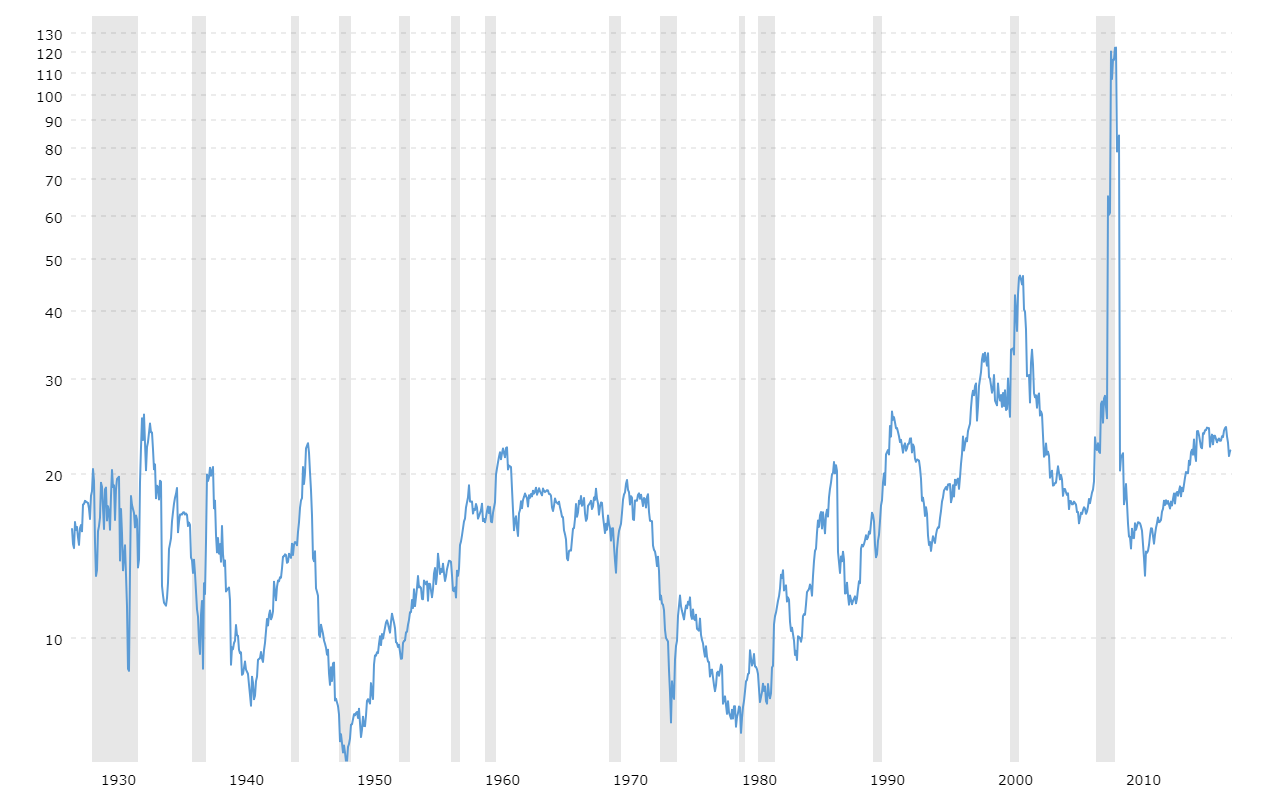
Conversely, the Forward PE uses projected earnings for the next twelve months based on analyst estimates. This is often considered more relevant by the market because stock prices are fundamentally “discounting mechanisms”—they reflect expectations of future performance rather than past achievements. Currently, the Forward PE for the S&P 500 is hovering around 21x to 22x, which is significantly higher than the 10-year average of approximately 17.8x. This suggests that investors are willing to pay a premium today for the growth they expect tomorrow.
Analyzing Current S&P 500 PE Levels in a Historical Context
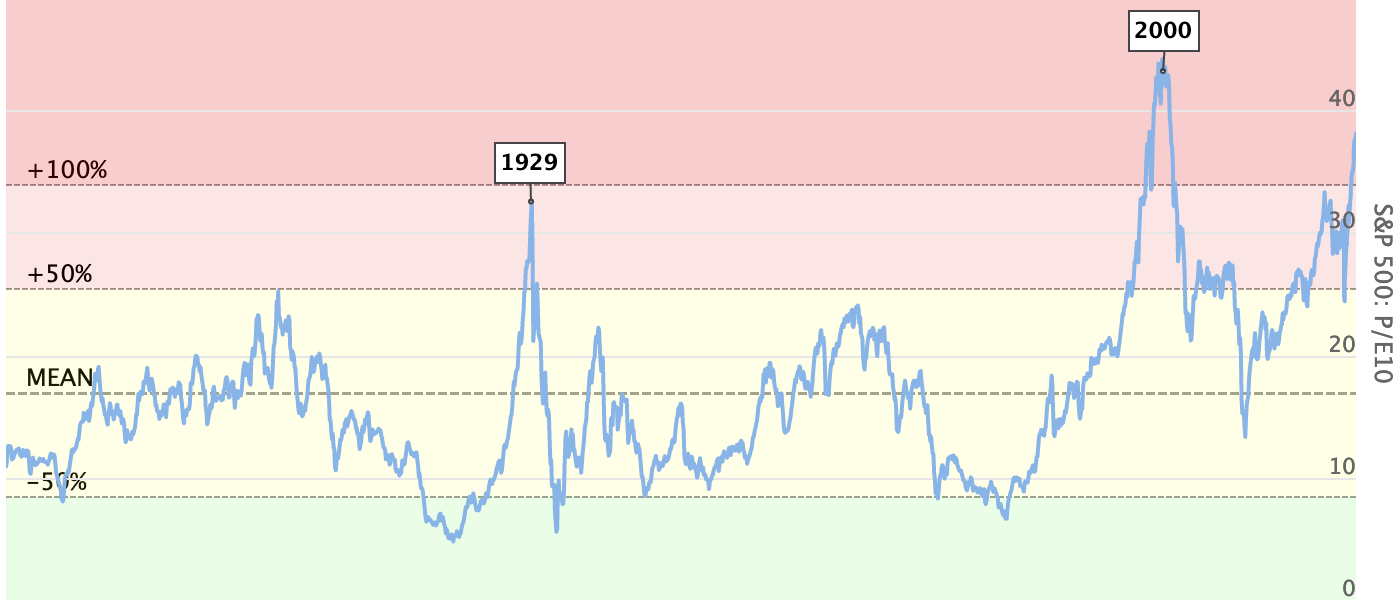
To understand if the current PE ratio is a cause for alarm or a sign of strength, one must look at where it sits relative to history. Historically, the mean PE ratio for the S&P 500 has fluctuated between 15x and 16x. When the ratio exceeds 20x, it typically signals a “hot” market; when it drops below 12x, it often signals a deep value opportunity or a period of intense economic distress.
Historical Averages vs. Today’s Reality
We are currently in a high-valuation regime. However, comparing today’s 21x Forward PE to the 15x average of the 1980s can be like comparing apples to oranges. The composition of the S&P 500 has shifted dramatically over the last forty years. In the past, the index was dominated by capital-intensive industrial, energy, and manufacturing firms. These businesses often carry lower PE ratios because their growth is capped by physical constraints.
Today, the index is dominated by software and technology firms. These companies often boast high profit margins, low capital expenditures, and “sticky” recurring revenue models. Because their growth potential is theoretically much higher, the market grants them higher PE multiples. Therefore, a “high” PE ratio today may not be as dangerous as it was in a different economic era.
The Impact of Interest Rates on Valuations
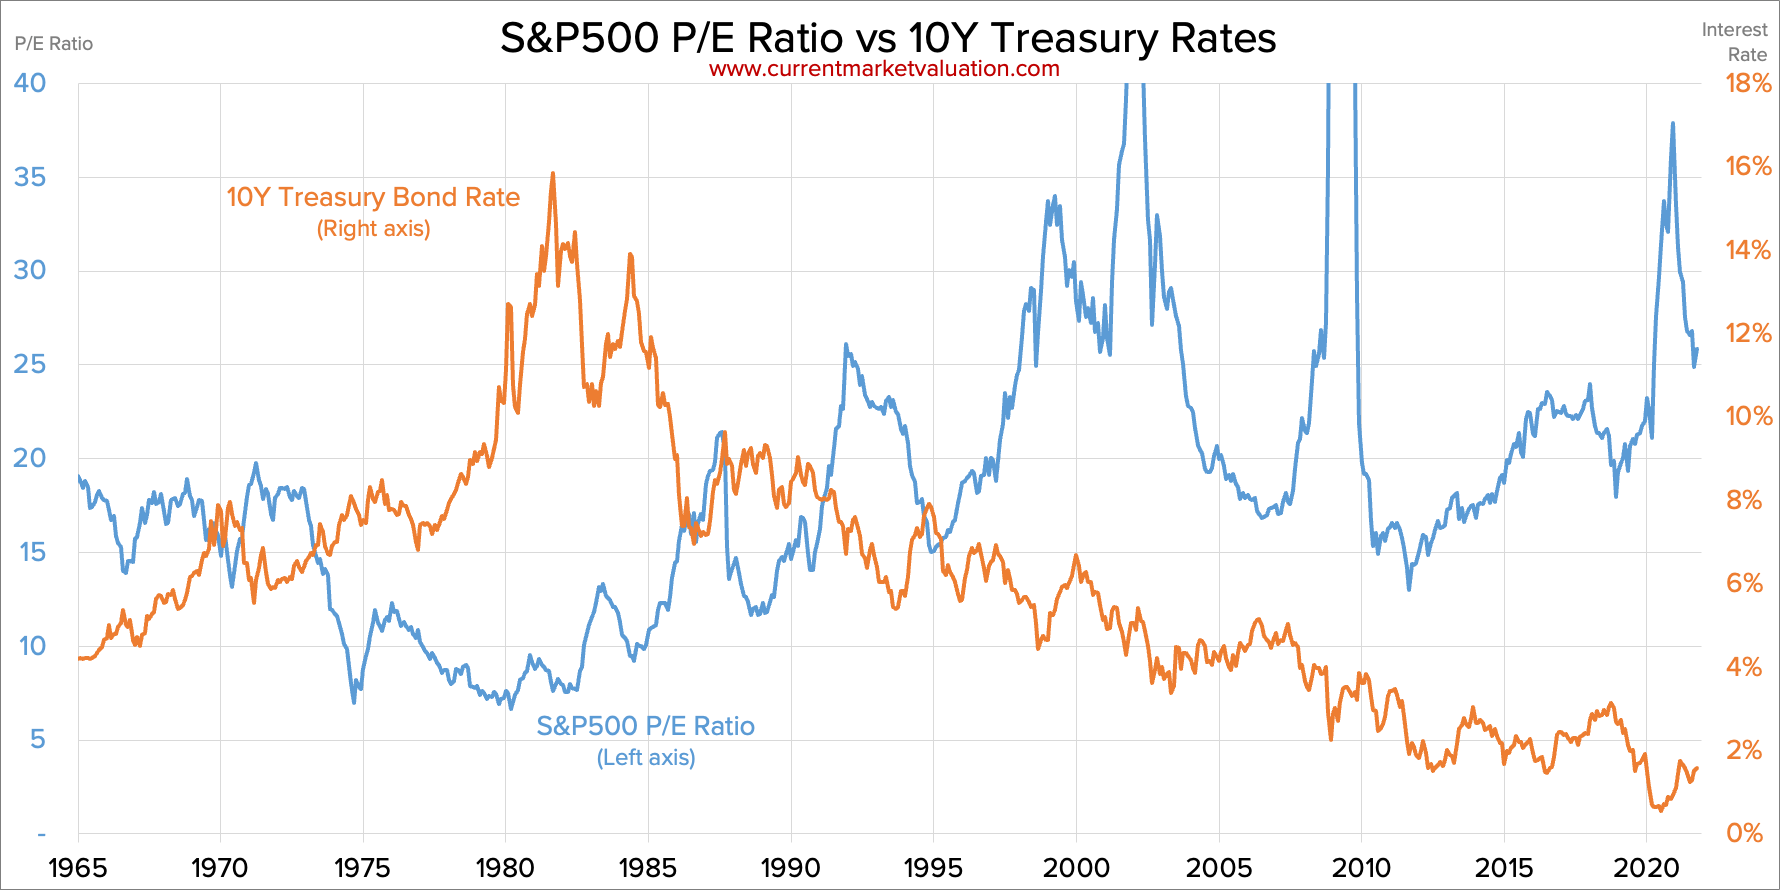
One cannot discuss the current PE ratio without addressing the role of the Federal Reserve and interest rates. The PE ratio is effectively the inverse of the earnings yield. When interest rates on “risk-free” assets like the 10-year Treasury note are low, investors are willing to pay more for stocks, driving PE ratios up.
In the current environment, interest rates have risen significantly from their near-zero pandemic lows. Usually, rising rates put downward pressure on PE multiples. The fact that the S&P 500 PE has remained resilient despite higher rates is a testament to the market’s optimism regarding Artificial Intelligence (AI) and the “soft landing” narrative for the US economy. Investors are betting that earnings growth will be strong enough to offset the higher cost of capital.
Why Current Valuations Matter for Your Portfolio
For the individual investor, the current S&P 500 PE ratio serves as a vital barometer for risk management. While it is a poor tool for timing the market in the short term—markets can stay “expensive” for years—it is an excellent predictor of long-term annualized returns.
Identifying Overvalued and Undervalued Markets
History shows a strong inverse correlation between the PE ratio at the time of purchase and the subsequent 10-year return. When you buy into the S&P 500 at a PE of 21x, your “margin of safety” is lower than if you bought in at 14x. This means that for the market to continue rising, companies must either meet their aggressive earnings targets or the market must be willing to pay an even higher multiple (multiple expansion). If earnings miss expectations, or if investors lose their appetite for risk (multiple contraction), the price of the index can fall sharply even if the companies remain profitable.
Sector Dispersion within the S&P 500
It is important to look under the hood of the aggregate PE ratio. The “headline” PE ratio of the S&P 500 is currently skewed by the “Magnificent Seven” (Alphabet, Amazon, Apple, Meta, Microsoft, Nvidia, and Tesla). If you look at the “S&P 500 Equal Weight Index,” which treats every company the same regardless of size, the PE ratio is often much lower.
This creates a bifurcated market. While the tech-heavy top of the index looks expensive, many sectors—such as financials, healthcare, and utilities—are trading at multiples much closer to their historical norms. For a diversified investor, this suggests that while the index as a whole is pricey, there are still pockets of value to be found.
Beyond the PE Ratio: Other Key Metrics for Modern Investors
While the standard PE ratio is the most quoted metric, sophisticated investors often use supplementary tools to get a more nuanced view of market valuation.
The Shiller PE (CAPE Ratio)
The Cyclically Adjusted Price-to-Earnings (CAPE) ratio, developed by Nobel laureate Robert Shiller, uses real per-share earnings over a 10-year period to smooth out fluctuations in corporate profits caused by the business cycle. Currently, the Shiller PE for the S&P 500 is significantly above its long-term average, sitting in the low 30s. Historically, levels this high have only been seen before the Dot-com crash and the post-pandemic boom. This suggests that, from a cyclical perspective, the market is indeed in the upper quintile of historical expensiveness.
Earnings Yield and the Equity Risk Premium
Another way to view the PE ratio is to flip it: the Earnings Yield (Earnings divided by Price). If the PE is 20, the earnings yield is 5%. Investors then compare this 5% yield to the yield on the 10-year Treasury bond (currently around 4.2% to 4.5%). The difference between the two is the “Equity Risk Premium” (ERP).
The ERP represents the extra return investors demand for taking on the risk of the stock market over a “safe” government bond. Currently, the ERP is at historically thin levels. This means investors are not getting much “extra” compensation for the risk of owning stocks compared to the safety of bonds. This is a critical factor for income-focused investors and retirees who may find bonds more attractive than stocks at current valuation levels.
Strategic Takeaways: Navigating the Market at Today’s Prices
So, what should an investor do when the S&P 500 PE ratio is high? The answer is rarely to move entirely to cash. Market timing based on PE ratios is notoriously difficult; the market can remain “overvalued” far longer than most investors can remain patient.
First, maintain a long-term perspective. If your investment horizon is twenty or thirty years, the specific PE ratio today is less important than your consistency in staying invested. Second, consider the role of earnings growth. If the AI revolution delivers the productivity gains that many analysts expect, corporate earnings could surge, effectively “growing into” the current high valuations and bringing the PE ratio down without a price drop.
Third, look for diversification. If the S&P 500’s concentration in high-PE tech stocks makes you uneasy, consider adding exposure to mid-cap stocks, small-cap stocks, or international markets, many of which are trading at significantly lower PE multiples.
Ultimately, the current S&P 500 PE ratio is a signal of high expectations. It reflects a market that is confident in the resilience of the American consumer, the brilliance of technological innovation, and the eventual easing of inflationary pressures. While the “price of admission” for the US stock market is currently high, the S&P 500 remains one of the greatest wealth-creation engines in history. By monitoring the PE ratio, investors can better understand the risks they are taking and adjust their strategies to ensure they are not overextended when the market cycle inevitably turns.
aViewFromTheCave is a participant in the Amazon Services LLC Associates Program, an affiliate advertising program designed to provide a means for sites to earn advertising fees by advertising and linking to Amazon.com. Amazon, the Amazon logo, AmazonSupply, and the AmazonSupply logo are trademarks of Amazon.com, Inc. or its affiliates. As an Amazon Associate we earn affiliate commissions from qualifying purchases.