
The Price-to-Earnings (P/E) ratio is arguably one of the most widely cited and scrutinized valuation metrics in the financial world. When applied to a broad market index like the S&P 500, it offers a macroeconomic snapshot of how the market as a whole is valuing corporate earnings. Investors, analysts, and economists frequently reference the S&P 500’s P/E to gauge whether the market is overvalued, undervalued, or trading at a fair price relative to its historical performance and prevailing economic conditions. Understanding what the P/E ratio represents, how it’s calculated for an index, and – crucially – how to interpret its current value, is fundamental for anyone looking to make informed investment decisions in today’s dynamic market landscape. While pinpointing the precise “current” P/E in a perpetually shifting market is a moment-by-moment exercise, comprehending the context around this critical number empowers investors to better assess market sentiment and potential future returns.
Understanding the P/E Ratio: A Cornerstone Valuation Metric
At its core, the Price-to-Earnings (P/E) ratio is a simple yet powerful tool used to evaluate a company’s stock price relative to its earnings per share. It answers the fundamental question: How much are investors willing to pay for each dollar of a company’s earnings? This metric extends beyond individual stocks to provide insights into entire market segments or indices.
Defining Price-to-Earnings (P/E)
The formula for the P/E ratio is straightforward:
P/E Ratio = Market Price per Share / Earnings Per Share (EPS)
For instance, if a company’s stock trades at $100 per share and has reported $5 in earnings per share over the past year, its P/E ratio would be 20x ($100 / $5). A higher P/E generally suggests that investors expect higher future earnings growth, or that the stock is considered less risky and therefore commands a premium. Conversely, a lower P/E might indicate lower growth expectations or that the stock is undervalued.
Why P/E Matters for Investors
The P/E ratio is crucial because it provides a quick benchmark for comparing the valuation of different companies within an industry, or even different industries themselves. It acts as an indicator of market sentiment and growth expectations. Companies with high growth potential, often found in sectors like technology or biotechnology, tend to have higher P/E ratios as investors are willing to pay more for their anticipated future earnings. Conversely, mature, slower-growth companies might have lower P/E ratios. For the S&P 500, its aggregate P/E reflects the collective market’s optimism or pessimism regarding the earnings power of America’s largest publicly traded companies.
Different Types of P/E Ratios
It’s important to recognize that not all P/E ratios are created equal. Different variations offer distinct perspectives:
-
Trailing P/E: This is the most common form, calculated using the company’s earnings per share over the past 12 months (last four reported quarters). It provides a historical view of valuation.
-
Forward P/E: This ratio uses analysts’ consensus estimates for a company’s earnings over the next 12 months. It’s a forward-looking metric that reflects future expectations, though it carries the inherent risk of forecast inaccuracies.
-
Cyclically Adjusted P/E (CAPE) or Shiller P/E: Developed by Nobel laureate Robert Shiller, this ratio takes the current price and divides it by the average of ten years of inflation-adjusted earnings. By smoothing out earnings over a business cycle, CAPE aims to reduce the volatility caused by short-term economic fluctuations, offering a more stable, long-term valuation perspective. This is particularly insightful for broad market indices like the S&P 500.
The S&P 500 P/E: A Macro View of Market Valuation
While an individual stock’s P/E is straightforward, calculating and interpreting the P/E for a broad market index like the S&P 500 presents unique considerations. It’s not simply an average of all constituent P/E ratios but a weighted aggregate that reflects the collective performance and valuation of 500 of the largest U.S. companies.
How the S&P 500 P/E is Calculated
The S&P 500 P/E is typically derived by dividing the total market capitalization of all 500 companies in the index by their aggregate earnings over a specific period (usually trailing 12 months). This calculation gives more weight to larger companies within the index, reflecting their greater influence on the overall market. So, a company like Apple or Microsoft, with massive market caps, will have a much more significant impact on the S&P 500’s P/E than a smaller constituent. This weighting ensures the index’s P/E accurately mirrors the true economic impact of its largest components.
The Dynamic Nature of the S&P 500’s Valuation
The S&P 500’s P/E is a constantly moving target, fluctuating with two primary drivers: the aggregate market capitalization of its components (which changes with stock prices) and their collective earnings per share (which are updated quarterly). As stock prices rise, the P/E tends to increase, assuming earnings remain constant. Conversely, if earnings grow faster than stock prices, the P/E will decrease. This dynamic interplay makes tracking the “current” P/E an ongoing process, reflecting the market’s continuous assessment of future profitability and risk.
Where to Find the Current S&P 500 P/E
Due to its dynamic nature, investors cannot rely on a static number. The current P/E of the S&P 500 is readily available from numerous financial data providers and news outlets. Major financial news websites (e.g., Bloomberg, Wall Street Journal, Yahoo Finance), index providers (e.g., S&P Dow Jones Indices), and investment platforms frequently publish real-time or end-of-day P/E figures for the index, often differentiating between trailing and forward P/E. Consulting these reliable sources ensures investors have access to the most up-to-date information for their analysis.
Interpreting the Current S&P 500 P/E: Context is Key
Merely knowing the current S&P 500 P/E is insufficient; its true value lies in its interpretation within a broader context. A single number means little without historical comparisons and an understanding of prevailing economic conditions.
Comparing to Historical Averages
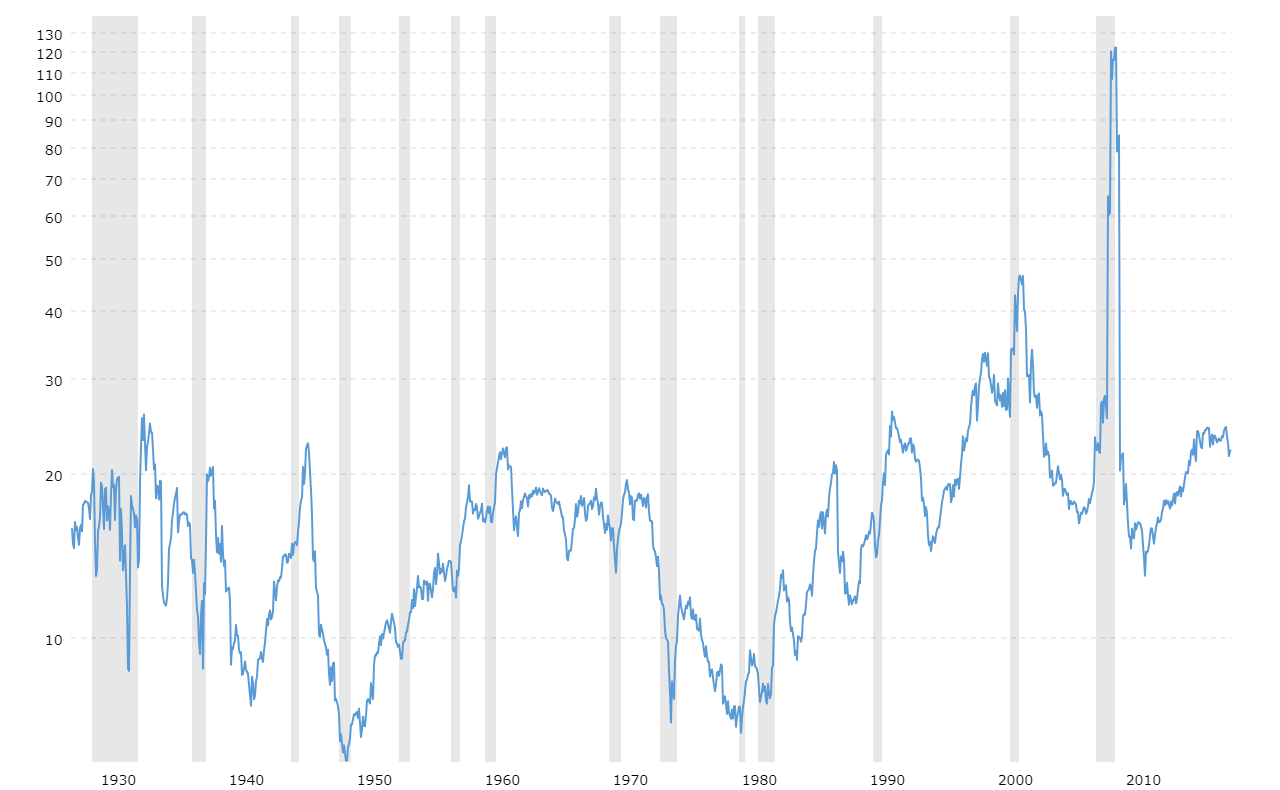
One of the most common ways to contextualize the current S&P 500 P/E is to compare it against its historical averages. Over the long run, the trailing P/E of the S&P 500 has often hovered in the range of 15x to 20x. If the current P/E is significantly higher than this historical average, it might suggest the market is overvalued, implying that investors are paying a premium for future earnings. Conversely, a P/E well below the average could signal an undervalued market, potentially indicating a buying opportunity, although other factors must be considered. Historical peaks, such as during the dot-com bubble, saw the S&P 500 P/E soar to unprecedented levels, only to contract sharply afterward.
P/E in Relation to Economic Cycles

The S&P 500’s P/E ratio is often highly correlated with the broader economic cycle. During periods of strong economic growth and corporate profitability (bull markets), investor confidence tends to be high, leading to increased willingness to pay more for earnings, thus pushing P/E ratios higher. Conversely, during economic downturns or recessions (bear markets), uncertainty and fear prevail, leading to lower P/E ratios as investors become more risk-averse and demand a lower price for earnings. Paradoxically, P/E ratios can sometimes appear artificially high during the initial stages of a recession if earnings decline faster than stock prices, creating a misleading picture of expensive valuation even as the market bottom approaches.
The Role of Interest Rates and Inflation
Macroeconomic factors, particularly interest rates and inflation, exert a significant influence on the S&P 500’s P/E. Lower interest rates generally make future earnings streams more valuable today (due to lower discount rates), leading investors to justify higher P/E ratios. This is often why periods of low-interest rates coincide with elevated market valuations. Conversely, rising interest rates tend to put downward pressure on P/E ratios as they increase the cost of capital and make fixed-income investments more attractive relative to equities. High inflation can also erode the value of future earnings, typically leading to lower P/E multiples unless earnings growth keeps pace or accelerates.
Factors Driving the S&P 500’s P/E Fluctuation
The S&P 500’s P/E ratio is not a static measure; it’s a dynamic reflection of various underlying economic and market forces. Understanding these drivers is essential for any nuanced analysis of market valuation.
Corporate Earnings Growth
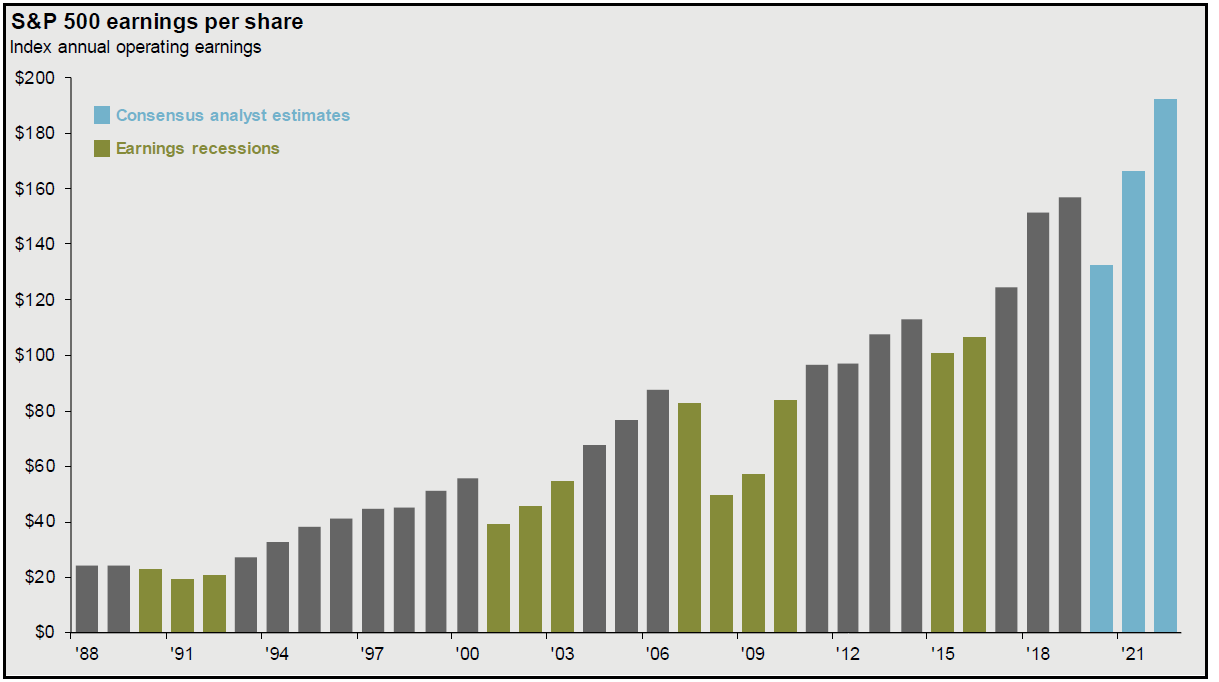
The most direct determinant of the P/E ratio is corporate earnings growth. When companies consistently deliver strong earnings growth, investors often bid up their stock prices, but if earnings grow even faster than prices, the P/E can actually decrease. Conversely, decelerating or negative earnings growth can cause P/E ratios to fall, even if stock prices remain somewhat stable, as the denominator in the P/E equation shrinks. For the S&P 500, aggregate earnings growth across its 500 constituents is a powerful force influencing its overall valuation multiple. Periods of robust economic expansion typically see strong earnings growth, which can support higher P/E levels.
Market Sentiment and Investor Confidence
Beyond raw numbers, market sentiment plays a critical, often psychological, role in P/E fluctuations. During periods of high investor confidence and optimism (often fueled by positive economic outlooks, technological breakthroughs, or stable geopolitical environments), investors are generally more willing to pay a premium for earnings, pushing P/E ratios higher. Conversely, fear, uncertainty, and doubt (FUD) driven by recessions, crises, or geopolitical instability can lead investors to demand lower prices for earnings, causing P/E multiples to compress. This emotional component can sometimes detach P/E ratios from fundamental realities in the short term, creating bubbles or panic-driven sell-offs.
Sectoral Composition and Weighting
The S&P 500 is a market-capitalization-weighted index, meaning larger companies have a greater impact on its overall performance and valuation. Furthermore, the dominant sectors within the index at any given time can significantly influence its aggregate P/E. For instance, if high-growth technology companies with typically higher P/E ratios constitute a large portion of the index (as they have in recent decades), they will naturally pull up the overall S&P 500 P/E. If value-oriented, lower-P/E sectors like utilities or industrials were to dominate, the index’s P/E might be lower. Shifts in sector leadership and weighting can therefore change the index’s valuation profile without a fundamental change in the economy.
Global Economic Environment
The S&P 500 does not exist in a vacuum. The global economic environment, including factors like global trade tensions, international interest rate policies, commodity prices, and geopolitical stability, can indirectly but significantly impact corporate earnings and investor sentiment. Many S&P 500 companies have substantial international operations, meaning their earnings are sensitive to global economic health and currency fluctuations. A robust global economy can bolster earnings and confidence, supporting higher P/E ratios, while global instability can introduce uncertainty and depress valuations.
P/E as an Investment Tool: Navigating Market Decisions
The S&P 500 P/E ratio is an indispensable tool in an investor’s arsenal, offering a broad indicator of market valuation. However, it is precisely that—an indicator, not a definitive buy or sell signal. Its true utility emerges when used in conjunction with other metrics and understood within its inherent limitations.
P/E as a Valuation Signal
As a primary valuation signal, a historically high S&P 500 P/E might suggest that the market is overvalued, implying that future returns could be modest or even negative if a correction occurs. Conversely, a historically low P/E could signal an undervalued market, potentially indicating attractive entry points for long-term investors. However, what constitutes “high” or “low” is subjective and often debated, especially in new economic paradigms or with different interest rate environments. For instance, consistently low-interest rates over extended periods might justify higher P/E ratios than historical norms because money is cheaper to borrow and earnings are discounted at a lower rate.
Limitations of the P/E Ratio
Despite its widespread use, the P/E ratio has several limitations:
-
Ignores Debt: P/E does not account for a company’s debt levels. A company with a low P/E but substantial debt might be riskier than one with a higher P/E and a clean balance sheet.
-
Accounting Gimmicks: Earnings can sometimes be manipulated through aggressive accounting practices, potentially distorting the P/E ratio.
-
Cyclical Industries: For highly cyclical industries (e.g., commodities, automotive), earnings can be extremely volatile. Using trailing earnings during a peak cycle might make a stock appear cheap (low P/E), just before earnings collapse, making forward P/E or CAPE more appropriate.
-
Growth Potential: P/E doesn’t explicitly capture future growth potential beyond what’s implicitly priced in. A high P/E could be fully justified if a company has exceptionally high and sustainable growth prospects.
-
Negative Earnings: If a company has negative earnings, its P/E ratio becomes meaningless.
P/E in Conjunction with Other Metrics
Given its limitations, the S&P 500 P/E should never be the sole determinant of investment decisions. Savvy investors integrate it with a holistic analysis using a range of other financial metrics, such as:
-
Price-to-Sales (P/S): Useful for companies with volatile or negative earnings.
-
Price-to-Book (P/B): Measures the market’s valuation of a company’s assets.
-
Dividend Yield: For income-focused investors.
-
Free Cash Flow (FCF): A crucial indicator of a company’s ability to generate cash, often considered harder to manipulate than earnings.
-
Debt-to-Equity Ratio: To assess financial leverage and risk.
-
Revenue Growth: To evaluate the underlying business expansion.
By combining the P/E with these indicators, investors can develop a more comprehensive and robust picture of market and individual stock valuation.
The Long-Term Investor’s Perspective
For long-term investors, the short-term fluctuations of the S&P 500 P/E are less critical than the underlying fundamentals and trends. While an extremely high P/E might warrant caution, and a very low one might suggest opportunity, focusing on the quality of the businesses within the index, their collective earning power, and the broader economic trajectory often yields better results than trying to time the market based on P/E alone. The S&P 500, as a representation of the U.S. economy’s leading enterprises, has historically delivered positive returns over the long haul, regardless of its P/E at any specific moment. The P/E serves as a valuable lens, but not the entire view, into the health and future prospects of the market.
aViewFromTheCave is a participant in the Amazon Services LLC Associates Program, an affiliate advertising program designed to provide a means for sites to earn advertising fees by advertising and linking to Amazon.com. Amazon, the Amazon logo, AmazonSupply, and the AmazonSupply logo are trademarks of Amazon.com, Inc. or its affiliates. As an Amazon Associate we earn affiliate commissions from qualifying purchases.