
In the vast and ever-evolving landscape of the internet, we often interact with websites as passive consumers. We click links, fill out forms, and marvel at visually stunning designs. But beneath the surface, a powerful tool exists, often overlooked by the average user, yet indispensable to anyone delving deeper into the digital realm: the browser console. For those navigating the worlds of tech, brand building, and even smart money management, understanding the browser console is akin to unlocking a secret level in a video game – it reveals hidden mechanics, offers unparalleled insight, and empowers you with a degree of control you never knew you had.

While its name might sound arcane, the browser console is, in essence, a developer’s best friend and a curious user’s gateway to understanding how websites truly function. It’s a built-in diagnostic and debugging tool found in every modern web browser – Chrome, Firefox, Safari, Edge, and their kin. Think of it as the backstage pass to a theatrical performance; you see the polished act on stage, but the console allows you to peek behind the curtain, observe the intricate workings, and even make minor adjustments.
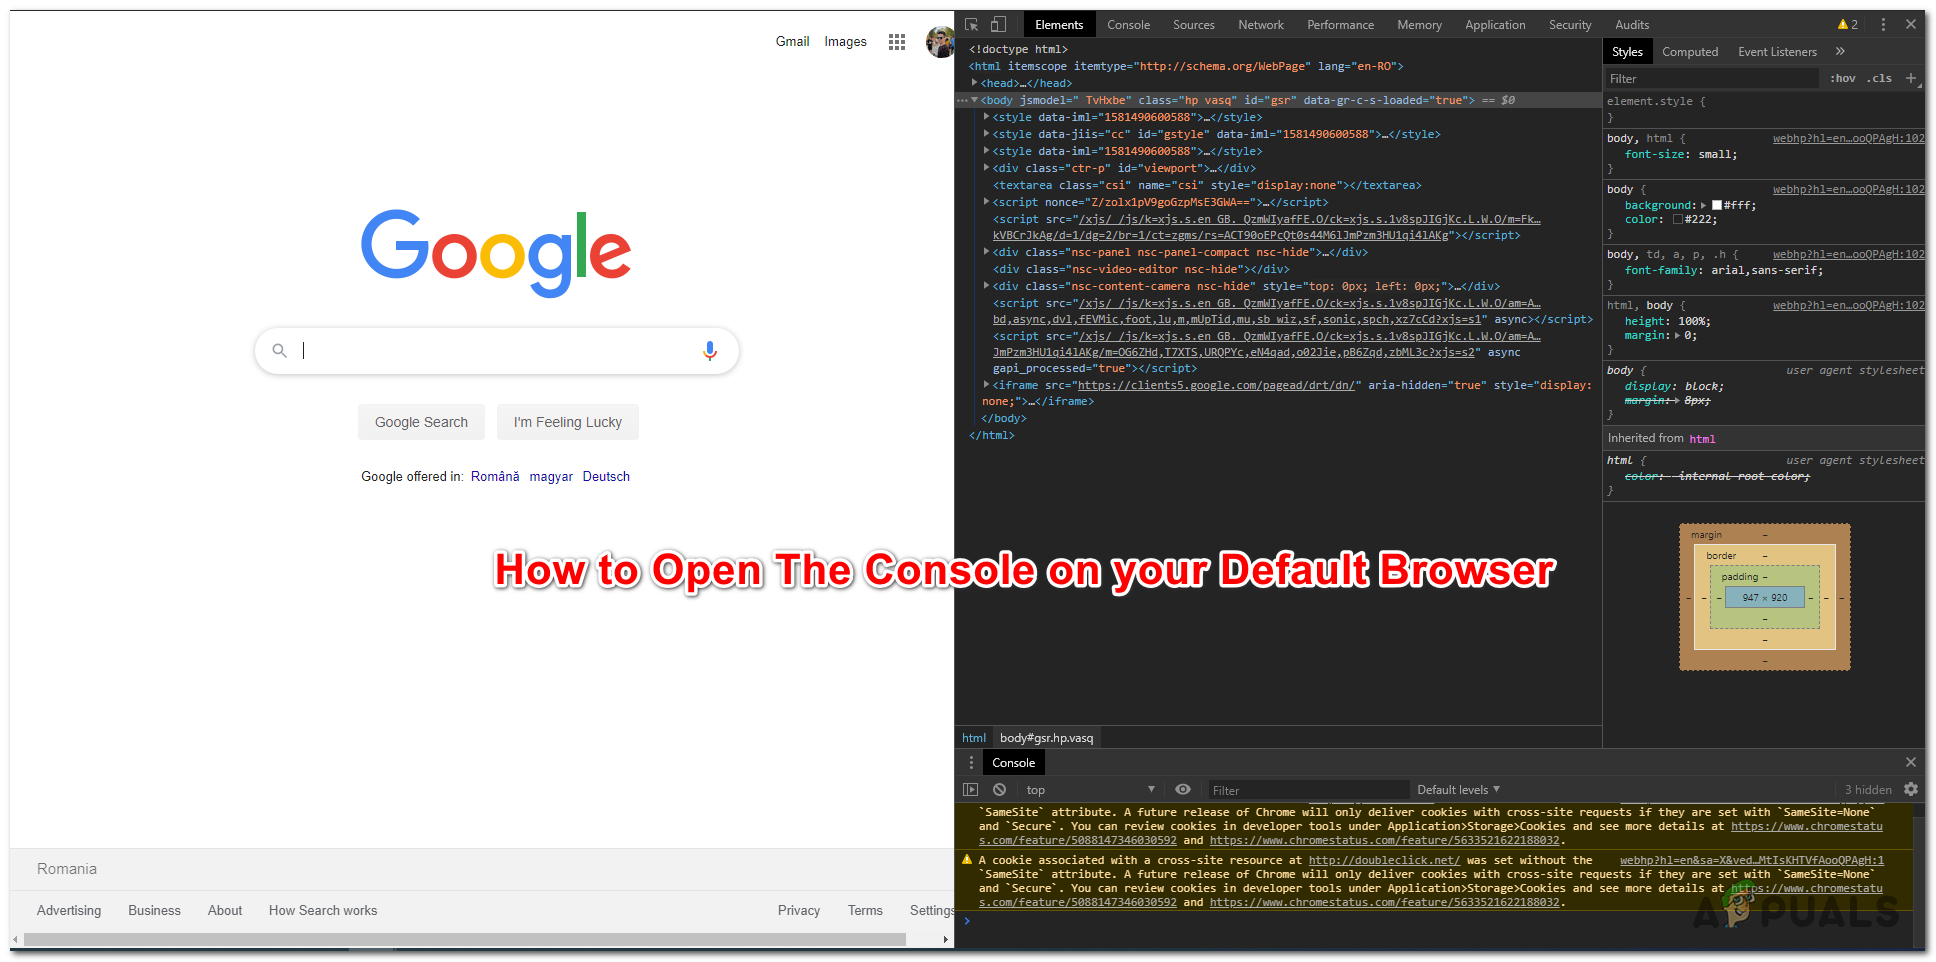
Its primary function is to display messages generated by JavaScript, the programming language that powers most interactive elements on websites. These messages can range from simple notifications about a script’s execution to detailed error reports that pinpoint exactly where something has gone wrong. But its utility extends far beyond just error reporting. It’s a dynamic environment where you can execute code, inspect the structure and styling of web pages, monitor network activity, and much more.
The Unseen Engine: How the Browser Console Interacts with Web Technology
For the tech enthusiast, the browser console is not just a tool; it’s a playground. It’s where theoretical knowledge about web development transforms into tangible observation. Understanding how websites are built and how they behave is crucial in our increasingly digitized world, and the console provides a direct window into this process.
Demystifying JavaScript: Errors and Warnings
At its core, the browser console is an interpreter of JavaScript. When a website’s code encounters an issue, it often sends a message to the console. These messages are typically categorized into two main types: Errors and Warnings.
-
Errors represent critical failures that prevent a script from executing correctly, or even halt the execution of a portion of the page. For instance, if a script tries to access a variable that doesn’t exist, or if there’s a typo in a command, an error will be thrown. These errors are invaluable for developers, as they directly point to the line of code causing the problem, saving hours of debugging time. For the curious tech user, seeing these errors can offer a glimpse into the fragility of web applications and the meticulous work required to maintain them. You might see messages like
Uncaught TypeError: Cannot read property '...' of undefinedorSyntaxError: Unexpected token.... -
Warnings, on the other hand, indicate potential issues that might not immediately break the website but could lead to unexpected behavior or suboptimal performance down the line. These could be related to deprecated features, insecure practices, or inefficient code. While not as severe as errors, understanding warnings can foster a more robust and secure web experience. For example, a warning might flag the use of an outdated JavaScript function that is scheduled to be removed in future browser versions.
Inspecting the Digital Blueprint: HTML and CSS
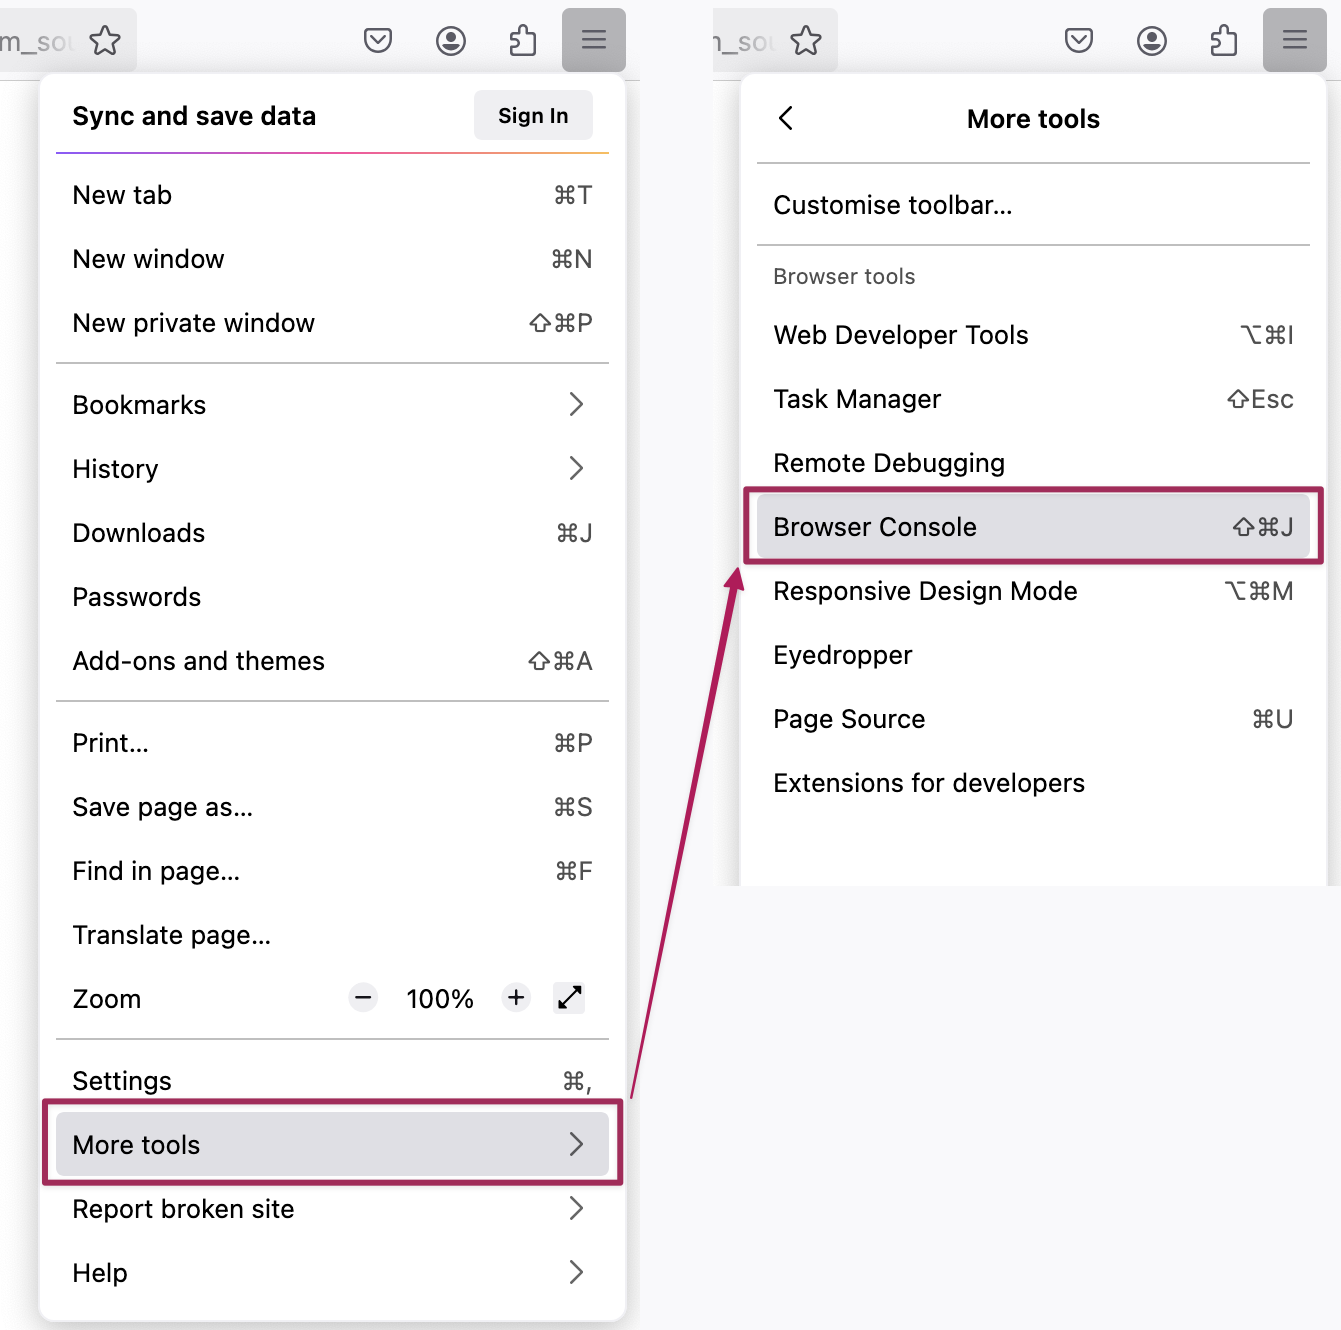
Beyond JavaScript, the browser console, often accessed through the “Developer Tools” or “Web Inspector,” allows you to delve into the very structure and presentation of a webpage.
-
Element Inspector: This feature lets you hover over any element on a webpage and see its corresponding HTML code. You can not only view the HTML but also manipulate it in real-time. This means you can change text, add or remove attributes, and even modify the HTML structure temporarily to see how it affects the page. For tech hobbyists, this is a powerful way to understand how web pages are constructed. Want to see what happens if you change a button’s text or hide an image? The element inspector is your tool.
-
Style Editor/Computed Styles: Similarly, you can inspect the CSS (Cascading Style Sheets) that dictates the visual appearance of a webpage. You can see all the styles applied to a particular element, their sources (which CSS file they come from), and their specificity. Furthermore, you can modify these styles directly in the console. Change a font size, alter a color, or adjust an element’s layout on the fly. This is incredibly useful for understanding responsive design principles and how visual elements are controlled. For those interested in web design or front-end development, this provides an immediate, hands-on way to learn and experiment.
The Console as a Brand Amplifier: Understanding User Experience and Digital Presence
While the browser console might seem like a purely technical tool, its implications extend significantly into the realm of branding and marketing. A well-functioning website is a cornerstone of a strong brand identity. Poor performance, broken links, or confusing user interfaces can erode trust and damage reputation. The browser console provides insights that can directly inform brand strategy and improve a company’s digital presence.
Diagnosing User Experience Bottlenecks
From a branding perspective, the user experience (UX) is paramount. If a website is slow to load, has broken interactive elements, or displays errors, potential customers or clients will quickly become frustrated. The browser console can help identify these UX bottlenecks.
-
Performance Monitoring: The “Network” tab within developer tools is a treasure trove of performance data. It shows you every request your browser makes to load a webpage – from HTML files and stylesheets to images and scripts. You can see how long each resource takes to load, identify slow-loading assets, and pinpoint potential delays. For a brand, this means understanding if their website is hindering potential conversions due to slow loading times. Are large images or unoptimized scripts making visitors leave before they even see the brand’s message? The console can reveal this.
-
JavaScript Errors and User Frustration: As mentioned earlier, JavaScript errors can lead to broken features. Imagine a scenario where a user can’t add an item to their cart due to a JavaScript error. This directly impacts potential revenue and creates a negative brand impression. By monitoring the console for errors, businesses can proactively identify and fix these issues, ensuring a smooth and positive user journey. This directly contributes to a stronger brand reputation.
Optimizing for Digital Visibility and Marketing Campaigns
The console also plays a role in understanding how a website interacts with marketing tools and search engines.
-
Tracking and Analytics: Many marketing platforms rely on JavaScript snippets to track user behavior, conversions, and campaign performance. These scripts also send messages to the console. By examining these messages, marketers can verify that their tracking codes are firing correctly and that data is being sent to their analytics platforms as expected. Are your Google Analytics tags working? Is your Facebook Pixel firing on product pages? The console can confirm this.
-
Understanding Dynamic Content and SEO: Modern websites often use JavaScript to load content dynamically. While this can enhance user experience, it can also pose challenges for search engine optimization (SEO) if not implemented correctly. The console can help developers and marketers understand how this dynamic content is being rendered and whether search engines are likely to be able to index it properly. This understanding is crucial for maintaining good search engine rankings and ensuring brand visibility online.
The Console for the Savvy Investor: Monitoring Online Platforms and Financial Tools
For individuals focused on personal finance, investing, and online income, the browser console might seem less directly relevant. However, its ability to scrutinize online platforms and understand their underlying mechanics can be surprisingly beneficial. When you’re relying on web-based tools for managing your money or generating income, understanding how these platforms operate can provide a crucial edge.
Verifying Online Transactions and Platform Integrity
When engaging with online financial platforms, whether for banking, investing, or e-commerce, a certain level of trust is inherent. The console can offer a degree of transparency, allowing you to peek under the hood and verify certain aspects of platform operation.
-
Network Activity and Data Transmission: The “Network” tab can reveal what data is being sent and received by the browser when you interact with a financial website. While you won’t see your sensitive credentials directly in plain text (they are usually encrypted), you can observe the endpoints the site is communicating with. This can be useful for understanding if a platform is communicating with expected, legitimate servers. If you notice unusual or unexpected network requests, it might warrant further investigation.
-
JavaScript for Transaction Confirmation: Some online transactions or confirmations might involve JavaScript. While not a primary security feature for sensitive data, understanding that a confirmation message is being generated by a script can offer a small layer of reassurance that the website is processing your request as intended. For instance, you might see console messages related to a successful API call for a purchase or a fund transfer.
Debugging and Optimizing Online Income Streams
For those pursuing online income, side hustles, or running small e-commerce businesses, website functionality is directly tied to revenue.
-
E-commerce Site Performance: If you’re selling products online, slow loading times or broken checkout processes can directly translate to lost sales. The console’s performance monitoring tools become invaluable for optimizing your online store. Identifying and fixing these issues can lead to increased conversion rates and a healthier online income stream.
-
Troubleshooting Affiliate Links and Ad Platforms: For affiliate marketers or those running ad-supported content, understanding how tracking scripts and ad integrations work is crucial. The console can help verify that affiliate links are firing correctly, that ad tags are loading, and that performance metrics are being reported accurately. This ensures that your efforts to generate online income are not being hampered by technical glitches.
Conclusion: Empowering Your Digital Journey
The browser console, far from being an intimidating tool reserved only for seasoned developers, is an accessible gateway to a deeper understanding of the digital world. Whether you’re a tech enthusiast eager to dissect the mechanics of the web, a brand manager striving for an impeccable online presence, or a savvy investor safeguarding your financial interests, the console offers invaluable insights.
By demystifying JavaScript errors, enabling you to inspect the very fabric of webpages, and providing a window into network activity, the browser console empowers you to move beyond passive consumption. It transforms you into an informed observer, capable of identifying issues, understanding performance, and even making temporary, experimental changes. In an era where our lives are increasingly intertwined with the digital realm, mastering the browser console is not just about learning a new skill; it’s about gaining a powerful advantage and navigating the web with greater confidence and control. It’s your hidden command center, waiting to be explored.
aViewFromTheCave is a participant in the Amazon Services LLC Associates Program, an affiliate advertising program designed to provide a means for sites to earn advertising fees by advertising and linking to Amazon.com. Amazon, the Amazon logo, AmazonSupply, and the AmazonSupply logo are trademarks of Amazon.com, Inc. or its affiliates. As an Amazon Associate we earn affiliate commissions from qualifying purchases.