When we ask, “What is the biggest tornado ever?” the answer is not merely a geographic location or a date on a calendar. It is a triumph of modern technology. Identifying the scale, intensity, and sheer physical dimensions of a record-breaking atmospheric event requires an intricate web of radar systems, mobile sensing platforms, and high-performance computing.
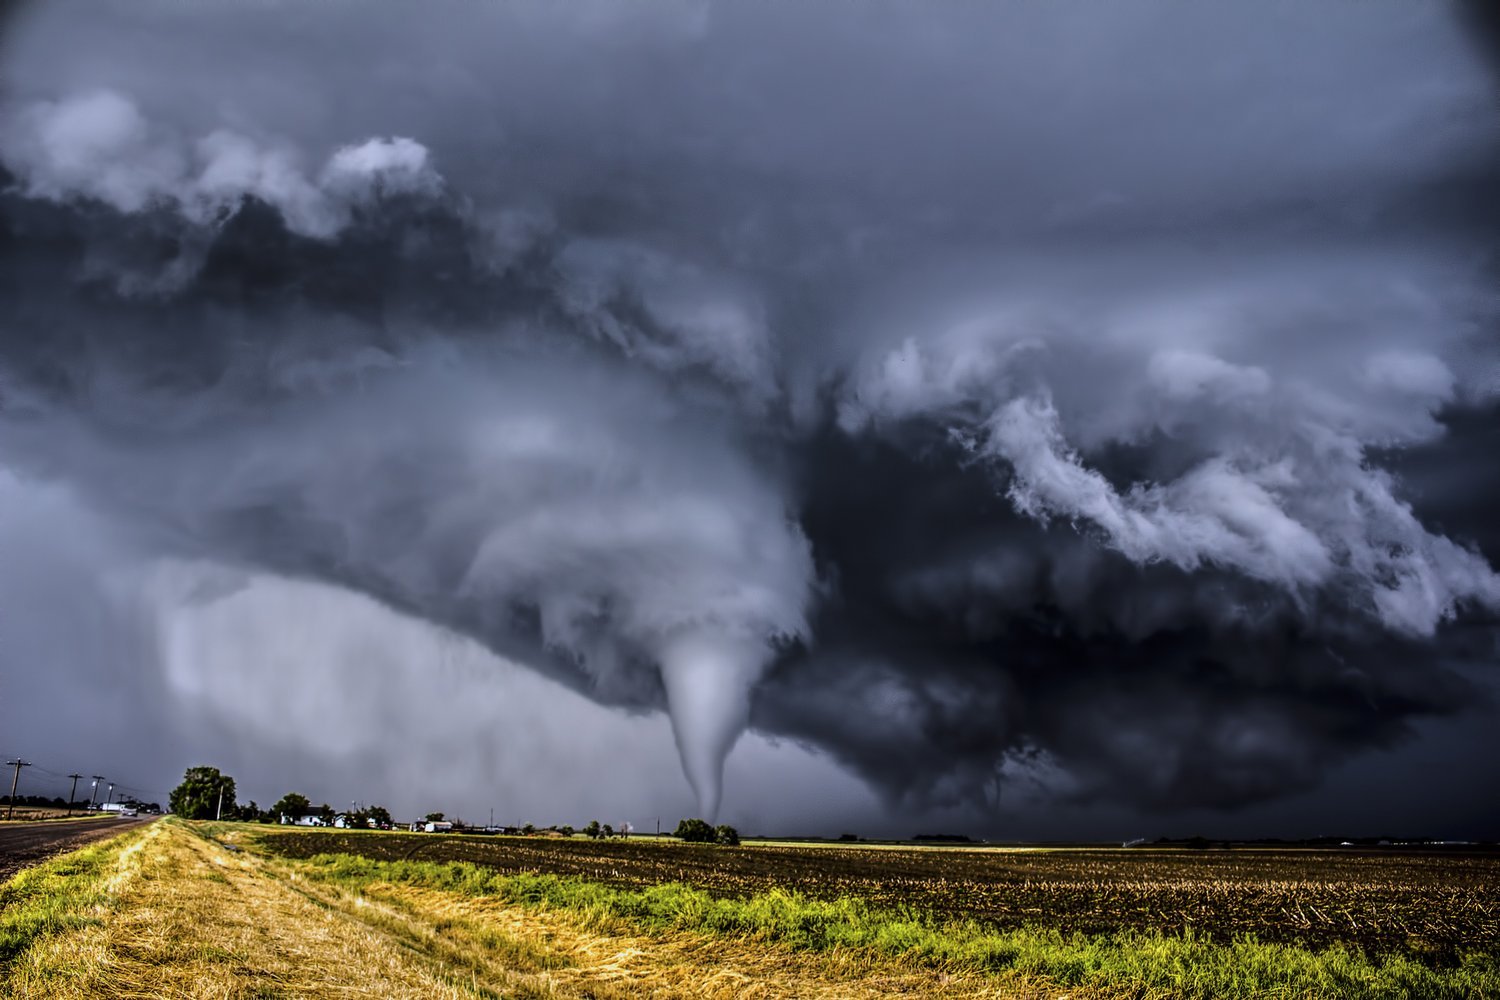
In the annals of meteorology, the May 31, 2013, El Reno, Oklahoma tornado stands as the undisputed champion in terms of width, stretching a staggering 2.6 miles across. However, determining this record wasn’t a matter of simple observation; it was a feat of technological precision. This article explores the sophisticated hardware and software ecosystems that allow us to measure these monsters and the digital simulations that help us understand how the “biggest” storms are born.

Measuring the Unmeasurable: The Evolution of Tornado Tracking Technology
For decades, the measurement of tornadoes was subjective. The original Fujita Scale (F-Scale) relied heavily on damage surveys—if a house was wiped clean off its foundation, the tornado was “big” and “strong.” But this method was flawed; a massive tornado hitting an open field might be rated lower than a smaller one hitting a city. The shift to a tech-centric measurement model has revolutionized our understanding of storm scale.
From Fujita to Enhanced Fujita: The Data-Driven Shift
In 2007, the National Weather Service transitioned to the Enhanced Fujita (EF) Scale. While still based on damage, the “Enhanced” part of the equation integrated more rigorous engineering data and technological assessment. Engineers developed “Damage Indicators” (DIs) and “Degrees of Damage” (DODs) that were standardized into software used by survey teams. This allowed for a more granular digital analysis of a storm’s impact, ensuring that the “size” of a tornado was backed by structural data rather than visual estimation.
Dual-Polarization Radar and the Quest for Real-Time Accuracy
Perhaps the most significant leap in identifying the biggest tornadoes was the implementation of Dual-Polarization (Dual-Pol) radar. Unlike traditional radar that sends out a single horizontal pulse, Dual-Pol sends both horizontal and vertical pulses.
This technological advancement allows meteorologists to identify the “Tornado Debris Signature” (TDS). By analyzing the size and shape of objects in the air, software can distinguish between raindrops, hailstones, and structural debris. When the biggest tornadoes occur, Dual-Pol technology provides a digital “fingerprint” of the debris field, allowing experts to measure the diameter of the circulation even when the storm is wrapped in rain and invisible to the naked eye.
The El Reno Record: A Case Study in Technological Observation
The 2013 El Reno tornado serves as the ultimate benchmark for “the biggest” because of the specific technology present on the ground that day. Without the deployment of advanced mobile radar units, the true scale of this 2.6-mile-wide behemoth might never have been officially recorded.
Why El Reno 2013 Challenges Standard Measurement Metrics
The El Reno tornado was an anomaly that pushed the limits of our measuring tools. It grew from a relatively standard size to its record-breaking width in a matter of minutes. Traditional stationary NEXRAD (Next-Generation Radar) sites were too far away to capture the low-level intensity with total precision. The “size” of this tornado was so vast that it actually encompassed several smaller “sub-vortices”—mini-tornadoes within the main circulation—that were themselves capable of EF3+ damage.
Mobile Doppler Radar: The Tech That Captured the Beast
The record for the biggest tornado was solidified by the use of RaXPol (Rapid-scan X-band Polarimetric) radar. This is a mobile, truck-mounted radar system designed for high-resolution imaging. Unlike stationary radars that might take five minutes to complete a full scan, RaXPol can scan the entire atmosphere in seconds.
On May 31, 2013, researchers from the University of Oklahoma utilized this tech to measure wind speeds of over 300 mph and a width that shattered previous records. This hardware allows scientists to “see” the internal structure of the storm in high definition, providing the data points necessary to crown El Reno as the largest ever. Without this specific mobile hardware, the 2.6-mile figure would have been an estimate; with it, it became a scientific fact.

Simulation and Supercomputing: Recreating the “Biggest” Storms in Virtual Space
Identifying the biggest tornado is only half the battle; the other half is understanding how the atmosphere produces such a massive vortex. This is where the world of “Big Tech” meets meteorology. To study these events, scientists turn to supercomputers and complex fluid dynamics software.
High-Resolution Atmospheric Modeling (WRF and Beyond)
The Weather Research and Forecasting (WRF) model is a next-generation mesoscale numerical weather prediction system. When a record-breaking tornado occurs, researchers input the atmospheric data—humidity, wind shear, temperature, and pressure—into supercomputers like the “Blue Waters” system at the University of Illinois.
By running these simulations, tech experts can create a “Digital Twin” of the biggest tornadoes. These simulations require quadrillions of calculations per second. In these virtual environments, researchers can “pause” the storm, look inside the funnel, and determine which technological variables led to the storm’s unprecedented size. This digital recreation is vital because it is often too dangerous or physically impossible to gather certain data types in the field.
Using AI and Machine Learning to Predict Tornadic Intensity
Artificial Intelligence is the latest tool in the tech arsenal for identifying massive storms. Machine learning algorithms are now being trained on decades of radar data to recognize the “pre-conditions” of a record-breaking tornado.
By feeding “Big Data” into neural networks, meteorologists are developing software that can predict not just if a tornado will form, but how large it could potentially become. These AI tools look for patterns in the “hook echo” and “vorticity” that are too subtle for the human eye to detect on a standard radar screen. This predictive tech is the frontline of defense for future events that might rival the El Reno record.
The Future of Storm Chasing: IoT, Drones, and Edge Computing
As we look toward the future, the technology used to identify the “biggest” tornadoes is moving from the truck to the sky. The next generation of data collection involves decentralized hardware and autonomous systems.
Deploying Probes into the Inflow: Hardware Innovations
For years, the “Holy Grail” of tornado tech was placing a probe directly in the path of the storm (famously dramatized in the movie Twister). Today, this is becoming a reality through the Internet of Things (IoT). Ruggedized sensors equipped with cellular and satellite uplinks are being deployed to capture pressure drops and wind speeds from the ground level of the largest tornadoes. These devices use “Edge Computing” to process data locally before transmitting it to the cloud, ensuring that critical data is saved even if the hardware is destroyed by the storm.
Unmanned Aerial Systems (UAS) and 3D Mapping
Drones are the new frontier in measuring storm scale. Equipped with LiDAR (Light Detection and Ranging) and high-definition photogrammetry software, drones can fly over a tornado path immediately after the event to create a 3D digital map of the destruction.
This technology allows for a much more accurate measurement of a tornado’s “width” and “path length.” By analyzing the direction of every fallen tree and the scouring of the soil, 3D mapping software can reconstruct the wind’s behavior with millimeter precision. This tech ensures that when we label a future storm as the “biggest ever,” the claim is backed by high-resolution geospatial data.
Conclusion: The Synergy of Data and Nature
The quest to identify the biggest tornado ever is, at its heart, a quest for better data. From the early days of visual estimates to the modern era of RaXPol radar and AI-driven simulations, technology has been the lens through which we view these atmospheric giants.
The 2.1-mile width of the Hallam, Nebraska tornado (2004) and the 2.6-mile width of the El Reno, Oklahoma tornado (2013) are more than just numbers—they are data points captured by a sophisticated technological infrastructure. As software becomes more predictive and hardware becomes more resilient, our ability to monitor these events will only improve. We may one day see a storm that surpasses El Reno, and when we do, it will be an array of sensors, satellites, and supercomputers that tell us exactly how big it truly was. Through the lens of technology, we turn a chaotic natural disaster into a measurable, understandable, and ultimately survivable digital record.
aViewFromTheCave is a participant in the Amazon Services LLC Associates Program, an affiliate advertising program designed to provide a means for sites to earn advertising fees by advertising and linking to Amazon.com. Amazon, the Amazon logo, AmazonSupply, and the AmazonSupply logo are trademarks of Amazon.com, Inc. or its affiliates. As an Amazon Associate we earn affiliate commissions from qualifying purchases.