For investors, financial analysts, and anyone looking to understand the health and potential of the U.S. stock market, the S&P 500 is an indispensable benchmark. It’s cited daily in news reports, forms the basis of countless investment products, and acts as a de facto report card for corporate America. Yet, while its name is ubiquitous, the concept of its “average return” is often oversimplified and can be misleading without proper context. Understanding what constitutes the average S&P 500 return, how it’s calculated, and what factors influence it is crucial for making informed financial decisions. This article will delve into the intricacies of this pivotal index, demystifying its historical performance and offering insights for both novice and seasoned investors.
Understanding the S&P 500: A Pillar of the U.S. Economy
Before dissecting its returns, it’s essential to grasp what the S&P 500 truly represents. Far from a mere collection of stocks, it is a carefully curated index designed to reflect the broader U.S. equity market.
What Exactly is the S&P 500?
The S&P 500, or Standard & Poor’s 500, is a stock market index that tracks the stock performance of 500 of the largest publicly traded companies in the United States. While it’s commonly referred to as representing “the 500 largest U.S. companies,” the selection process is more nuanced than simple market capitalization. A committee at S&P Dow Jones Indices selects companies based on criteria such as market size, liquidity, public float, sector representation, and financial viability. This careful selection ensures that the index is a robust and representative cross-section of the U.S. economy, encompassing diverse industries from technology and finance to healthcare and consumer goods. Because it is a market-capitalization-weighted index, companies with larger market values have a greater impact on the index’s performance. For instance, a small movement in a giant like Apple or Microsoft will influence the S&P 500 more than a larger percentage move in a smaller constituent company.
Why is it Such a Crucial Benchmark?
The S&P 500 holds immense significance for several reasons. Firstly, its broad representation makes it an excellent proxy for the overall health of the U.S. stock market and, by extension, the U.S. economy. When the S&P 500 performs well, it often signals economic growth and corporate prosperity. Secondly, it serves as a common benchmark against which professional money managers and individual investors measure their performance. If an actively managed fund consistently underperforms the S&P 500 over several years, questions arise about its value proposition. Thirdly, its composition and historical data provide a wealth of information for academic research into market trends, volatility, and economic cycles. Finally, the S&P 500 is the bedrock for countless passive investment vehicles, such as index funds and exchange-traded funds (ETFs), allowing ordinary investors to gain diversified exposure to the large-cap U.S. market at a low cost. Its pervasive influence makes understanding its performance metrics a fundamental aspect of financial literacy.
Deconstructing “Average Return”: Different Metrics and Timeframes
When someone asks “what is the average S&P 500 return,” the answer isn’t a single, universally agreed-upon number. The concept of “average” can be calculated in different ways, each offering a distinct perspective on the index’s performance over various time horizons.
The Historical Arithmetic Average Return
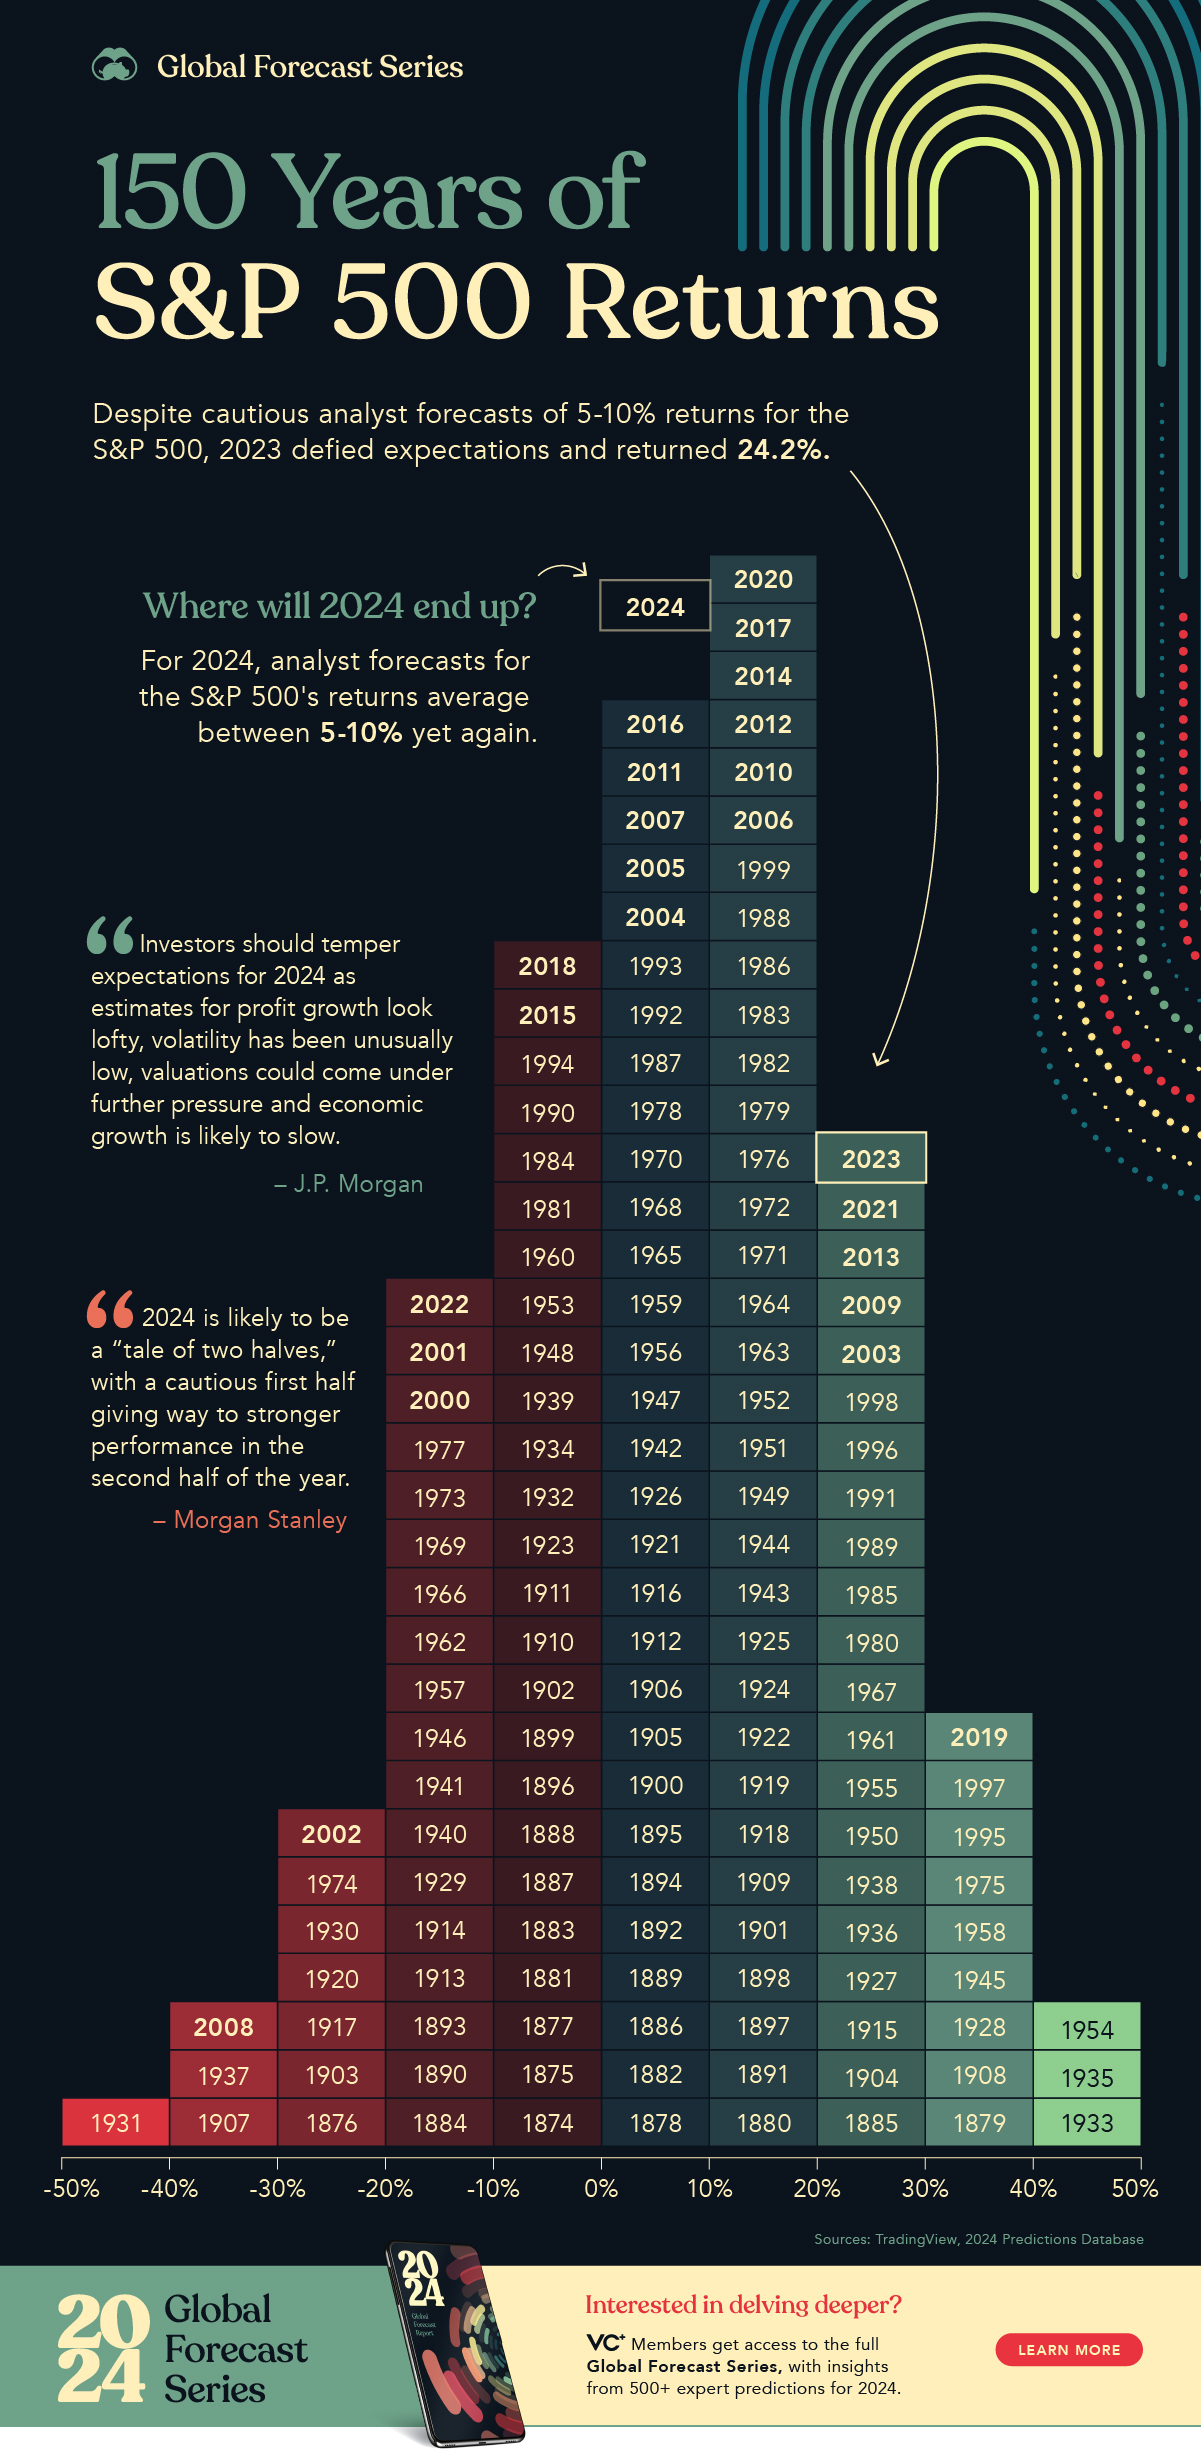
Perhaps the most commonly cited figure is the arithmetic average return. This is simply the sum of all annual returns divided by the number of years. Historically, many sources will state that the S&P 500 has delivered an average annual return of approximately 10% to 12% since its inception in 1926 (or since 1957, when it expanded to 500 stocks). For instance, looking at data often cited, from 1957 through 2023, the average annual return (including dividends) has been around 10.15%. From 1926 to 2023, it’s closer to 10.26%. This figure is useful for understanding the typical year-to-year performance but doesn’t fully capture the impact of compounding on investment growth over a long period. Averages can mask significant year-to-year volatility, where a 30% gain in one year might be followed by a 20% loss the next.
The Geometric Average (Compound Annual Growth Rate – CAGR)
For investors looking to understand the actual growth of an investment over time, the geometric average, also known as the Compound Annual Growth Rate (CAGR), is a more appropriate metric. Unlike the arithmetic average, CAGR accounts for the effect of compounding, where returns generated in one period are reinvested and generate further returns in subsequent periods. Because it smooths out volatility and considers the sequential nature of returns, the geometric average will always be less than or equal to the arithmetic average. For instance, while the arithmetic average might be 10-12%, the CAGR for the S&P 500 over its long history (e.g., 1957-2023) might be closer to 8-9% when taking into account the impact of volatility and compounding. This figure provides a more realistic representation of what an investor might have actually experienced in terms of wealth accumulation.
The Impact of Time Horizon
The “average return” is highly dependent on the period over which it’s calculated. Short-term averages (e.g., 1-year, 3-year, 5-year) can be incredibly volatile and misleading. A recent bull market might inflate the average, while a bear market could drastically depress it. For example, the S&P 500 might have a stellar 20% return in one year but a -15% return the next. A 10-year average will typically be more stable, and a 20-year or 50-year average will provide the most reliable long-term historical context. The S&P 500 has consistently demonstrated positive returns over longer periods, historically proving itself as a powerful wealth-building tool for patient investors.
Accounting for Inflation (Real vs. Nominal Returns)
Another crucial distinction is between nominal returns and real returns. Nominal returns are the raw, unadjusted figures we’ve discussed. Real returns, however, adjust for the erosion of purchasing power due to inflation. If the S&P 500 returns 10% in a year, but inflation is 3%, your real return is only 7%. While a 10-12% average nominal return is often cited, the average real return over the very long term (after accounting for inflation) is generally closer to 7-8%. This distinction is vital for long-term financial planning, as it tells you how much your purchasing power has actually increased, not just the numerical value of your investments.
Factors Influencing S&P 500 Performance
The S&P 500 doesn’t move in a vacuum; its performance is a complex interplay of various economic, corporate, and geopolitical forces. Understanding these factors provides deeper insight into market fluctuations.
Economic Cycles and Market Sentiment
The performance of the S&P 500 is intricately linked to the broader economic cycle. During periods of economic expansion, corporate earnings typically grow, consumer spending increases, and investor confidence rises, leading to bull markets and positive returns. Conversely, recessions, characterized by declining economic activity, higher unemployment, and reduced corporate profits, often trigger bear markets and negative returns for the index. Market sentiment, driven by fear and greed, can also cause significant short-term swings, sometimes decoupling from underlying economic fundamentals.
Corporate Earnings and Innovation
Ultimately, the value of a stock, and by extension the S&P 500, is tied to the earnings power of the companies within the index. Strong corporate earnings growth, driven by increased sales, cost efficiencies, and market expansion, fuels stock price appreciation. Innovation plays a critical role here, as companies that develop new technologies, products, or services can capture market share and drive significant revenue growth, pushing the overall index higher. The S&P 500’s long-term upward trend is largely a testament to the continuous innovation and adaptability of American corporations.
Interest Rates and Monetary Policy
The Federal Reserve’s monetary policy, particularly its decisions on interest rates, significantly impacts the S&P 500. Lower interest rates generally make borrowing cheaper for companies, stimulating investment and growth. They also make stocks more attractive relative to bonds, as the yield on “risk-free” assets is lower. Conversely, higher interest rates can increase borrowing costs, dampen economic activity, and make bonds more appealing, potentially putting downward pressure on stock valuations. The Fed’s forward guidance and balance sheet policies also play a crucial role in shaping market expectations and, consequently, S&P 500 performance.
Geopolitical Events and Global Trends
The globalized nature of modern economies means that geopolitical events and global trends can have far-reaching effects on the S&P 500. Major conflicts, trade wars, pandemics, supply chain disruptions, and shifts in international relations can create uncertainty, impact corporate supply chains and sales, and trigger market volatility. For example, the COVID-19 pandemic caused a rapid market crash followed by a swift recovery, demonstrating the market’s sensitivity to global crises and its resilience in adapting to new realities. Similarly, commodity price shocks, often linked to geopolitical tensions, can impact energy and manufacturing costs for S&P 500 companies.
Investing in the S&P 500: Strategies for the Long Term
For individual investors, gaining exposure to the S&P 500 is a cornerstone of many long-term financial strategies. Its diversified nature and historical resilience make it an attractive option for wealth building.
Passive Investing through Index Funds and ETFs
The most common and efficient way for individual investors to participate in the S&P 500’s performance is through passive investment vehicles like S&P 500 index funds or exchange-traded funds (ETFs). These funds aim to replicate the performance of the index by holding the same stocks in the same proportions. They offer broad diversification across 500 companies with very low expense ratios, as they do not require active management or frequent trading. Investing in such funds allows individuals to capture the average S&P 500 return (minus minimal fees) without trying to pick individual winning stocks.
The Power of Dollar-Cost Averaging
Dollar-cost averaging is a powerful strategy when investing in volatile assets like the stock market. It involves investing a fixed amount of money at regular intervals (e.g., $200 every month), regardless of whether the market is up or down. When prices are high, your fixed investment buys fewer shares; when prices are low, it buys more shares. Over time, this strategy helps to smooth out the average cost per share and reduces the risk of making a large investment at an unfavorable market peak. For long-term S&P 500 investors, dollar-cost averaging can mitigate the impact of short-term market fluctuations and harness the power of compounding.
Rebalancing Your Portfolio
While investing in an S&P 500 index fund provides excellent diversification within large-cap U.S. equities, it’s often part of a broader investment portfolio. Periodically, an investor should rebalance their portfolio to maintain their desired asset allocation. For example, if your target is 70% S&P 500 and 30% bonds, and a strong bull market pushes your S&P 500 allocation to 80%, rebalancing would involve selling some S&P 500 fund shares and buying bonds to return to your target allocation. This systematic approach helps manage risk and ensures your portfolio aligns with your long-term financial goals and risk tolerance.
The Importance of Long-Term Perspective
Perhaps the most critical lesson for S&P 500 investors is the necessity of a long-term perspective. While the market experiences corrections and bear markets, its historical trajectory has been upward over extended periods. Trying to time the market by buying low and selling high is notoriously difficult and often leads to missing significant recovery periods. By committing to a long-term investment horizon (e.g., 10, 20, or even 30+ years), investors can ride out the inevitable periods of volatility and allow the power of compounding to work its magic, capturing the substantial average returns the S&P 500 has historically offered.
Beyond the Average: What Investors Need to Consider
While the average S&P 500 return is a compelling statistic, it’s only one piece of the puzzle. A holistic view of investing requires considering individual circumstances and other critical factors.
Risk vs. Reward
The S&P 500 offers attractive potential returns, but it’s crucial to remember that these returns come with inherent risk. Equities are generally more volatile than bonds or cash equivalents. There is no guarantee that historical average returns will repeat in the future, and investors can lose money, especially over shorter timeframes. The trade-off between risk and reward is fundamental to investing. Higher potential returns typically mean higher risk. Investors must assess their comfort level with potential losses before committing capital to equity investments.
Individual Financial Goals and Risk Tolerance
An investor’s personal financial goals (e.g., retirement, homeownership, education savings) and their individual risk tolerance should dictate their investment strategy, not just the historical average return of an index. A young investor with decades until retirement might comfortably withstand more volatility and allocate a larger portion to equities. In contrast, someone nearing retirement might prioritize capital preservation and opt for a more conservative asset allocation. Understanding your time horizon, liquidity needs, and emotional response to market downturns is paramount.
Diversification Beyond the S&P 500
While the S&P 500 provides diversification across 500 large U.S. companies, true diversification often extends beyond a single index or asset class. A well-rounded portfolio might include international equities (developed and emerging markets), bonds (government and corporate), real estate, or other alternative assets. This further diversification can help reduce overall portfolio risk, as different asset classes tend to perform differently under various economic conditions, potentially smoothing out returns and enhancing stability.
The Role of Dividends
When discussing S&P 500 returns, it’s vital to differentiate between price return and total return. Price return reflects only the change in the index’s value. Total return, however, includes the reinvestment of dividends paid by the constituent companies. Dividends, especially when reinvested, significantly boost long-term returns. For example, while the S&P 500’s average price return might be 8-9% historically, its average total return (with dividends reinvested) often climbs into the 10-12% range, underscoring the substantial contribution of these regular payouts to overall wealth accumulation.
In conclusion, the average S&P 500 return is a powerful metric that has demonstrated the remarkable wealth-generating capacity of the U.S. stock market over the long term. However, it’s not a static or simple figure. Understanding the nuances between arithmetic and geometric averages, considering the impact of inflation, and recognizing the influence of economic and market forces are essential. For the diligent, patient investor, leveraging the S&P 500 through low-cost index funds, adopting strategies like dollar-cost averaging, and maintaining a long-term perspective can be a cornerstone of a successful financial future, always remembering that past performance is not indicative of future results and a personalized approach is key.
aViewFromTheCave is a participant in the Amazon Services LLC Associates Program, an affiliate advertising program designed to provide a means for sites to earn advertising fees by advertising and linking to Amazon.com. Amazon, the Amazon logo, AmazonSupply, and the AmazonSupply logo are trademarks of Amazon.com, Inc. or its affiliates. As an Amazon Associate we earn affiliate commissions from qualifying purchases.