
In the world of high-stakes investing, few tickers command as much attention, debate, and volatility as Tesla (TSLA). For seasoned institutional investors and retail traders alike, the fundamental question often revolves around valuation: Is the company overvalued, undervalued, or priced for perfection? To answer this, the most common tool in the financial shed is the Price-to-Earnings (PE) ratio. However, applying a standard PE analysis to a company as complex and multifaceted as Tesla requires a nuanced understanding of market dynamics, growth expectations, and the broader economic landscape.
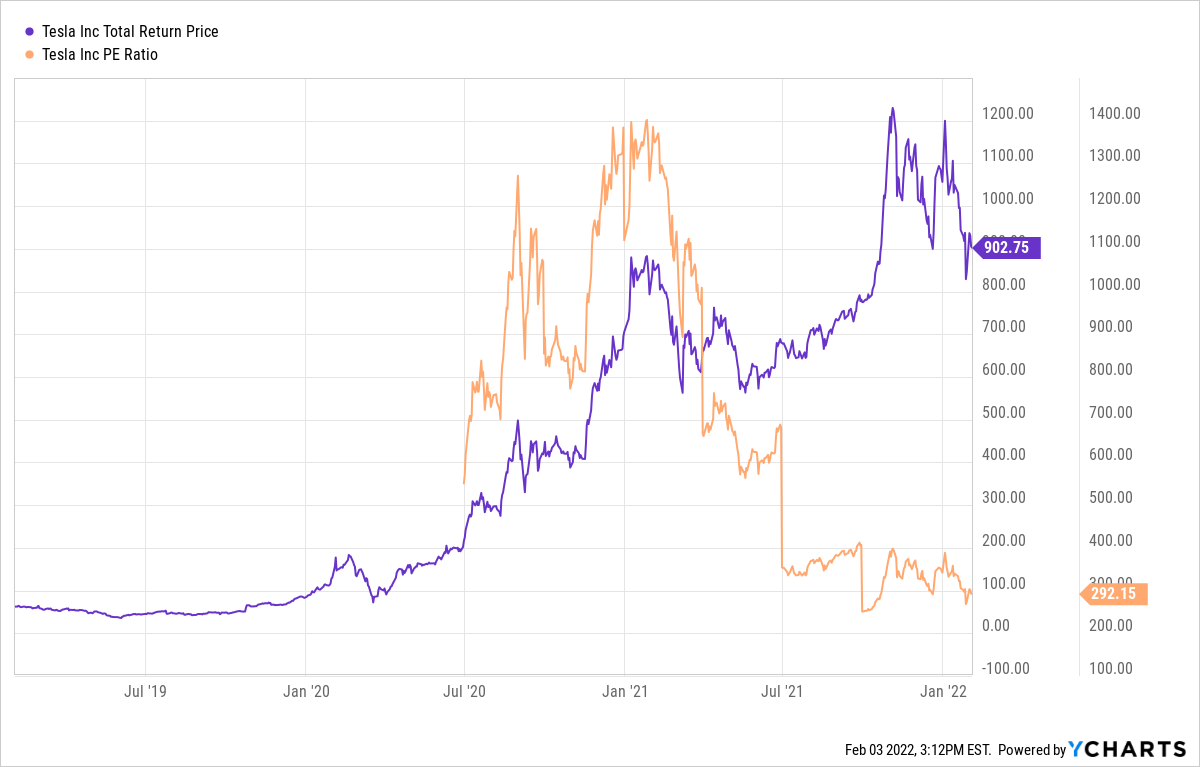
The PE ratio is a primary metric used to determine if a stock’s market price is reasonable compared to its actual earnings. In the case of Tesla, this number has historically fluctuated from the triple digits to figures that defy traditional financial modeling. To understand what Tesla’s PE ratio is—and more importantly, what it signifies—one must look beyond the raw numbers and into the mechanics of growth-stage investing.
The Basics of the Price-to-Earnings Ratio in the Context of TSLA
At its core, the PE ratio is calculated by taking the current share price of a company and dividing it by its earnings per share (EPS). This resulting number tells an investor how much the market is willing to pay today for every dollar of the company’s profit. For a mature, stable company in the utility or consumer staples sector, a PE ratio might hover between 15 and 20. Tesla, however, has rarely operated within these conventional boundaries.
How to Calculate Tesla’s PE Ratio
To find Tesla’s PE ratio at any given moment, you look at two specific variables. The first is the market price, which is influenced by daily trading sentiment, news cycles, and macroeconomic trends. The second is the earnings. In the financial world, we typically look at two variations of this metric:
-
Trailing PE Ratio: This uses the earnings from the previous 12 months. It provides a historical perspective on how the company has actually performed.
-
Forward PE Ratio: This uses projected earnings for the next 12 months. For growth stocks like Tesla, the forward PE is often considered more relevant because it reflects the market’s expectations for future scaling and profitability improvements.
The Significance of a High PE Ratio
When Tesla maintains a high PE ratio—often significantly higher than the S&P 500 average—it indicates that investors expect massive earnings growth in the future. A high multiple suggests that the “market” believes Tesla’s current profits are only a fraction of what they will be in five or ten years. It is a vote of confidence in the company’s ability to disrupt not just the automotive industry, but energy and artificial intelligence as well.
The Divergence: Why Tesla’s PE Ratio Defies Automotive Standards
One of the most frequent points of contention among financial analysts is the comparison between Tesla and “Legacy Auto” manufacturers like Ford, General Motors, or Toyota. From a purely traditional standpoint, these companies often trade at PE ratios between 5 and 10. When Tesla trades at a PE of 40, 60, or even 80, critics argue the stock is a bubble. However, proponents argue that Tesla is not an automobile company, but a technology powerhouse.
Software Margins vs. Hardware Margins
The primary reason for Tesla’s elevated PE ratio is its margin profile. Traditional car manufacturers deal with razor-thin margins and massive overhead. Tesla, conversely, has integrated software-as-a-service (SaaS) elements into its business model. Features like Full Self-Driving (FSD) represent high-margin revenue streams. When an investor looks at Tesla’s PE, they aren’t just looking at the profit from a physical car sale; they are looking at the recurring revenue potential of software updates and autonomous subscriptions.
The Ecosystem Play: Energy and Robotics
Another factor keeping Tesla’s PE ratio in the “growth” category is its diversification. Tesla Energy, which includes the Powerwall and Megapack utility-scale batteries, is growing at a rate that often outpaces the automotive segment. Furthermore, the market’s valuation of Tesla includes “optionality” for future products like the Optimus humanoid robot and the dedicated Robotaxi network. Traditional PE analysis struggles to account for products that are not yet contributing to the bottom line, leading to a “premium” price that reflects future disruption.
Vertical Integration and Cost Leadership
Tesla’s ability to maintain a healthy PE ratio even during price wars is a testament to its vertical integration. By manufacturing their own battery cells and controlling their supply chain, they maintain a cost advantage over competitors. Investors are willing to pay a higher multiple (a higher PE) for a company that demonstrates a superior ability to manage costs and sustain profitability in a high-interest-rate environment.
Historical Context: Navigating the Volatility of Tesla’s Valuation Multiples

To truly understand what Tesla’s PE ratio represents, one must look at its historical trajectory. There have been periods where Tesla’s PE was effectively infinite because the company was not yet profitable. Following its inclusion in the S&P 500 and its subsequent string of profitable quarters, the PE ratio became a more tangible metric, though no less volatile.
The Peak Valuation Era
During the liquidity-rich environment of 2020 and 2021, Tesla’s PE ratio skyrocketed. At certain points, it exceeded 1,000. In this environment, the ratio was less a measure of current value and more a measure of speculative fervor. Investors were betting on a world where Tesla owned the vast majority of the global car market. As the company scaled production in Giga Shanghai and Giga Berlin, the “E” (earnings) began to catch up with the “P” (price), causing the ratio to compress to more “reasonable” triple-digit levels.
Earnings Compression and the 2023-2024 Shift
In more recent fiscal years, Tesla has faced a different challenge: earnings compression. To maintain volume growth in a competitive EV market, Tesla aggressively cut prices. While this moved more units, it hit the net income. When earnings drop or grow more slowly than the stock price, the PE ratio rises. Conversely, if the stock price drops while earnings remain steady, the PE ratio becomes more attractive to value-oriented investors. Observing this dance between price cuts and profit margins is essential for anyone tracking Tesla’s valuation.
Beyond the PE Ratio: Alternative Metrics for Assessing Tesla’s Value
While the PE ratio is a vital snapshot, it is rarely the only metric a sophisticated investor uses, especially for a high-beta stock like Tesla. Because Tesla’s earnings can be impacted by non-cash items, regulatory credit sales, and heavy R&D spending, other financial tools provide a clearer picture.
The PEG Ratio (Price/Earnings to Growth)
The PEG ratio is often considered a superior metric for growth stocks. It takes the PE ratio and divides it by the annual EPS growth rate. A PEG ratio of 1.0 is generally considered “fair value.” If Tesla has a high PE of 60 but is growing its earnings at 60% per year, its PEG ratio is 1.0, suggesting it may actually be a bargain compared to a “cheap” stock with no growth.
Price-to-Sales (P/S) Ratio
In periods where earnings are reinvested so heavily into R&D that net income is low, investors look at the P/S ratio. This measures the stock price against total revenue. It helps investors understand how much the market values Tesla’s market share and top-line expansion, regardless of short-term profitability fluctuations caused by building new factories or developing new battery chemistries.
EBITDA and Free Cash Flow
For a capital-intensive business, Earnings Before Interest, Taxes, Depreciation, and Amortization (EBITDA) offers a look at operational efficiency. Perhaps more importantly, Free Cash Flow (FCF) shows how much actual cash Tesla is generating after accounting for capital expenditures. Tesla’s ability to fund its own growth without returning to the capital markets for debt or equity raises is a major reason why its PE ratio remains higher than its peers.
Strategic Considerations for Value and Growth Investors
Deciding whether Tesla’s PE ratio is “too high” or “just right” depends entirely on an investor’s time horizon and risk tolerance. The ratio is a reflection of sentiment as much as it is a reflection of math.
The Case for the “Premium” Valuation
Growth investors argue that Tesla’s PE ratio will always look expensive on a trailing basis because the market is looking forward. They point to the potential of the Dojo supercomputer and the massive data advantage Tesla holds in the autonomous driving space. From this perspective, the current PE is a “buy” signal because the future earnings potential of an autonomous fleet will eventually dwarf current automotive earnings, making the current price look cheap in retrospect.
The Case for Caution
Value investors, on the other hand, warn that a high PE ratio leaves no room for error. If Tesla misses delivery targets, faces regulatory hurdles with FSD, or sees a decline in brand loyalty, a high PE can lead to a rapid and painful “multiple contraction.” In this scenario, the stock price drops to align with a more conservative valuation, even if the company remains profitable.
Macroeconomic Influence
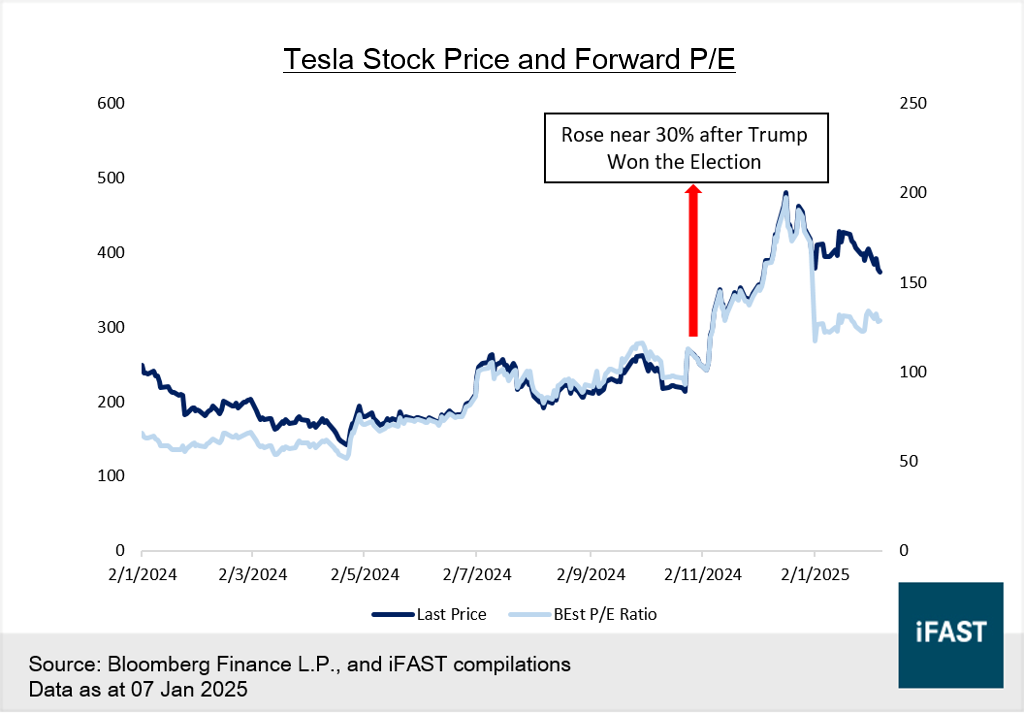
Finally, it is crucial to recognize that Tesla’s PE ratio does not exist in a vacuum. It is heavily influenced by the “risk-free rate” (Treasury yields). When interest rates are low, investors are willing to pay more for future earnings, driving up PE ratios across the tech sector. When rates rise, the present value of those future earnings decreases, typically leading to a lower PE ratio for growth stocks like Tesla.
In conclusion, Tesla’s PE ratio is a dynamic indicator of market faith. It encapsulates the tension between Tesla’s identity as a car manufacturer and its ambition as an AI and energy titan. By monitoring this ratio alongside growth rates and macroeconomic shifts, investors can better navigate the complexities of one of the modern era’s most significant financial stories. Whether the ratio is in the 40s or the 400s, it remains the ultimate scoreboard for the market’s belief in Elon Musk’s long-term vision.
aViewFromTheCave is a participant in the Amazon Services LLC Associates Program, an affiliate advertising program designed to provide a means for sites to earn advertising fees by advertising and linking to Amazon.com. Amazon, the Amazon logo, AmazonSupply, and the AmazonSupply logo are trademarks of Amazon.com, Inc. or its affiliates. As an Amazon Associate we earn affiliate commissions from qualifying purchases.