
In the fast-paced world of finance, information is the most valuable currency. For anyone looking to navigate the complexities of the stock market, whether a seasoned day trader or a novice retail investor, the “stock ticker” is the fundamental tool that bridges the gap between raw data and actionable insight. Often visualized as a scrolling bar of symbols and numbers at the bottom of news broadcasts or flashing across digital displays in Times Square, the stock ticker is the pulse of the global economy.

To understand what a stock ticker is, one must look beyond the flickering lights and recognize it as a sophisticated communication system. It provides a real-time report of the trading activity for specific securities, offering a continuous stream of data that includes stock symbols, share prices, and the volume of trades. This guide delves into the mechanics, history, and strategic importance of the stock ticker within the realm of personal finance and investing.
The Evolution and Anatomy of the Stock Ticker
The stock ticker has a storied history that reflects the evolution of financial technology and market accessibility. Understanding its origins and how to read its modern components is the first step toward financial literacy.
From Paper Tape to Digital Screens
The term “ticker” actually derives from the sound made by the original mechanical machines used in the late 19th century. Invented in 1867 by Edward Calahan and later improved upon by Thomas Edison, the ticker tape machine revolutionized Wall Street. Before its invention, information from the trading floor was delivered via messengers (often called “runners”). The ticker tape machine allowed for the transmission of stock price information over telegraph lines, printing the data onto long, thin strips of paper known as ticker tape.
Today, the physical tape has been replaced by high-speed electronic data feeds, but the nomenclature remains. Modern digital tickers update in milliseconds, providing a global audience with instantaneous access to market movements that once took hours or days to disseminate.
Decoding the Components: Symbol, Price, and Movement
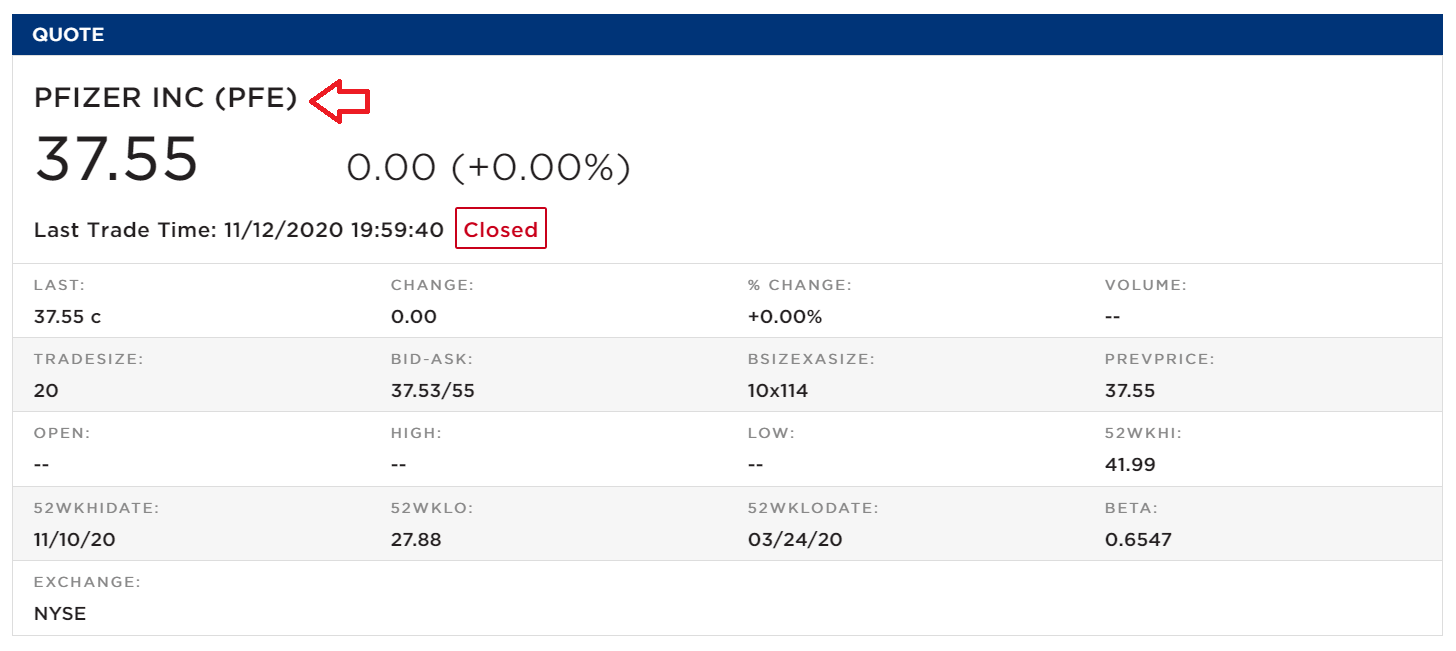
A stock ticker display might look like a chaotic string of characters at first glance, but it follows a very specific logic. To read a ticker effectively, an investor must recognize three primary elements:
-
The Ticker Symbol: This is a unique arrangement of characters representing a specific publicly traded company. For instance, Apple Inc. is represented by AAPL, while Microsoft uses MSFT. Historically, companies on the New York Stock Exchange (NYSE) used one to three letters, while those on the NASDAQ used four.
-
Shares Traded (Volume): This indicates the number of shares involved in the most recent transaction. In many modern ticker scrolls, the volume is summarized or omitted for brevity, but it remains a critical data point in detailed financial feeds.
-
Price and Directional Change: The ticker shows the current price at which the stock is trading. Adjacent to this price is usually a triangle (up or down) or a plus/minus sign, often color-coded (green for an increase, red for a decrease). This indicates the change in price relative to the previous day’s closing price.
Why Stock Tickers Are Essential for Modern Investors
For the individual investor, the stock ticker is more than just a decorative element of a financial news program; it is a vital instrument for monitoring market health and personal wealth.
Real-Time Data and Market Transparency
The primary value of the stock ticker lies in transparency. By providing a continuous flow of price data, the ticker ensures that all market participants have access to the same information simultaneously. This democratization of data is what allows a retail investor sitting at a home computer to compete on a relatively level playing field with institutional traders.
Without the real-time feedback of a ticker, price discovery—the process by which the market determines the value of an asset through the interactions of buyers and sellers—would be opaque and inefficient. The ticker confirms that a trade has occurred, providing “last-sale” data that serves as a benchmark for everyone else in the market.
Monitoring Portfolio Performance and Volatility
For those managing their own investments, the ticker serves as a constant feedback loop. By watching the ticker symbols of the companies in their portfolio, investors can gauge the impact of news events, earnings reports, or macroeconomic shifts in real-time.
Furthermore, the ticker is the first indicator of market volatility. During periods of economic uncertainty, the speed at which the ticker updates and the magnitude of the price swings provide a visual representation of market sentiment. Seeing a “sea of red” on a ticker feed can be a signal for defensive positioning, while a consistent upward trend might indicate a “bull market” where aggressive growth strategies are more appropriate.
Types of Stock Tickers and Where to Find Them
In the digital age, stock tickers are categorized based on their data source and the speed at which they deliver information. Choosing the right type of feed depends on an investor’s specific goals and budget.
Consolidated Tapes and Exchange-Specific Feeds
In the United States, ticker data is organized through what is known as the Consolidated Tape. This system aggregates trading data from various exchanges (like the NYSE and NASDAQ) into a single, unified stream.
-
Network A: Reports trades for stocks listed on the New York Stock Exchange.
-
Network B: Reports trades for stocks listed on regional exchanges and certain ETFs.
-
Network C: Reports trades for stocks listed on the NASDAQ.
For most casual investors, a consolidated view is sufficient. However, professional traders often pay for “Level 2” data, which provides a more granular look at the “order book,” showing not just the last price paid, but the specific prices at which people are currently offering to buy (bid) and sell (ask).
Digital Platforms: Apps, Websites, and News Crawlers
Accessibility is at an all-time high. Investors no longer need to stand in a brokerage firm to see the tape. Common sources include:
-
Financial News Networks: Channels like CNBC and Bloomberg feature a perpetual ticker “crawl” at the bottom of the screen.
-
Investment Apps: Platforms like Robinhood, E*TRADE, or Fidelity provide personalized tickers for a user’s watchlist.
-
Web Portals: Google Finance and Yahoo Finance offer free, real-time (or slightly delayed) ticker data for thousands of global securities.
It is important for investors to note whether their ticker feed is “real-time” or “delayed.” Many free services delay ticker data by 15 to 20 minutes, which may not matter for a long-term investor but is critical for anyone attempting to time a trade.
Advanced Metrics: Moving Beyond the Basic Ticker
While the basic ticker tells you the “what” (what price a stock is trading at), advanced investors use ticker-related data to understand the “why” and “how much longer.”
Volume and Market Capitalization
While the price tells you the value of a single share, the volume tells you the strength of the conviction behind that price. If a stock’s ticker symbol shows a significant price jump on very low volume, it may be a “head fake”—a move that lacks the support of the broader market and could quickly reverse. Conversely, a price move accompanied by high volume suggests that institutional investors (like pension funds or hedge funds) are moving in, giving the trend more credibility.
Market capitalization, though not always displayed on a scrolling ticker, is a metric derived from the ticker price. By multiplying the ticker price by the total number of outstanding shares, an investor determines the total market value of a company. This helps in categorizing the stock as “small-cap,” “mid-cap,” or “large-cap,” which dictates the risk profile of the investment.
Bid-Ask Spreads and Liquidity Indicators
The “spread” is the difference between the highest price a buyer is willing to pay and the lowest price a seller is willing to accept. In a highly “liquid” stock—one that is traded frequently, like Apple—the spread is usually only a penny or two. On the ticker, this is reflected in smooth, frequent price updates.
In contrast, “illiquid” stocks may have wide spreads. An investor watching the ticker for a low-volume “penny stock” might see the price jump 10% on a single trade, simply because the gap between the buyer and seller was so large. Understanding this nuance prevents investors from being misled by the rapid percentage changes sometimes seen on a ticker feed.

Conclusion: Mastering the Flow of Financial Information
The stock ticker is much more than a relic of the 19th-century telegraph; it is the essential language of modern finance. It distills the infinite complexity of global commerce into a streamlined, readable format that empowers individuals to take control of their financial destinies.
By understanding how to decode ticker symbols, analyze price movements, and interpret volume and liquidity, an investor transforms from a passive observer into an informed participant. Whether you are monitoring a retirement account or looking for the next big growth opportunity, the ticker is your primary window into the health of your investments. In a world where market conditions can change in a heartbeat, staying tuned to the ticker is not just a habit—it is a strategic necessity for anyone serious about building and protecting their wealth.
aViewFromTheCave is a participant in the Amazon Services LLC Associates Program, an affiliate advertising program designed to provide a means for sites to earn advertising fees by advertising and linking to Amazon.com. Amazon, the Amazon logo, AmazonSupply, and the AmazonSupply logo are trademarks of Amazon.com, Inc. or its affiliates. As an Amazon Associate we earn affiliate commissions from qualifying purchases.