The S&P 500, often referred to simply as “the S&P,” stands as one of the most widely recognized and influential stock market indexes globally. It serves as a critical benchmark for the performance of large U.S. companies and, by extension, a significant barometer for the overall health of the American economy. For investors, financial analysts, and economists alike, understanding the S&P 500 is fundamental to navigating the complex world of finance. Far from being a mere collection of stock prices, it represents a dynamic portfolio curated to reflect the broad market, offering deep insights into trends, corporate profitability, and investor sentiment.
The Benchmark of U.S. Stock Market Performance
At its core, the S&P 500 is an index maintained by S&P Dow Jones Indices, a joint venture between S&P Global and CME Group. It is designed to be a leading indicator of U.S. equities and a representative proxy for the broader economy. However, its sophisticated construction goes far beyond simply listing the largest companies.
Defining the S&P 500 Index
The S&P 500 index tracks the stock performance of 500 of the largest publicly traded companies in the United States. Unlike some other indexes that might focus on specific sectors or a narrower range of stocks, the S&P 500 aims for broad market representation across various industries. It is a market-capitalization-weighted index, meaning companies with larger market values (share price multiplied by the number of outstanding shares) have a greater impact on the index’s overall performance. This methodology ensures that the index’s movements accurately reflect the influence of the most substantial players in the U.S. stock market. It’s crucial to remember that you cannot directly invest in the S&P 500 itself; rather, investors gain exposure through various financial products designed to track its performance.
Selection Criteria for Inclusion
The selection of companies for inclusion in the S&P 500 is not arbitrary. A committee at S&P Dow Jones Indices rigorously evaluates potential candidates based on several key criteria to ensure the index accurately reflects the large-cap segment of the U.S. market. These criteria include, but are not limited to: the company must be a U.S. company, have a market capitalization of at least $14.6 billion (as of recent updates, though this figure can change), be highly liquid, have a public float of at least 10% of its shares, and have recent positive earnings (sum of the most recent four consecutive quarters’ GAAP earnings per share must be positive, as must the most recent quarter). The committee also considers factors such as sector balance, financial viability, and the company’s ability to maintain its large-cap status. This rigorous selection process ensures the index remains a credible and relevant measure of the large-cap U.S. stock market.
Market-Cap Weighting Explained
The market-capitalization-weighted methodology is a cornerstone of the S&P 500’s design. In simple terms, if Company A has a market capitalization of $1 trillion and Company B has a market capitalization of $100 billion, Company A will have ten times the impact on the index’s performance compared to Company B. This means that significant movements in the stock price of a company like Apple, Microsoft, or Amazon will exert a far greater influence on the S&P 500’s overall value than similar percentage movements in a smaller constituent company. While this accurately reflects the economic influence of larger corporations, it also means the index can be heavily concentrated in a few dominant companies, potentially leading to less diversification than a purely equal-weighted index might offer.
Why the S&P 500 Matters to Investors
The S&P 500’s prominence extends far beyond its statistical composition. It has become an indispensable tool for investors, fund managers, and policymakers for a multitude of reasons, influencing investment decisions and portfolio construction worldwide.
A Barometer for the U.S. Economy
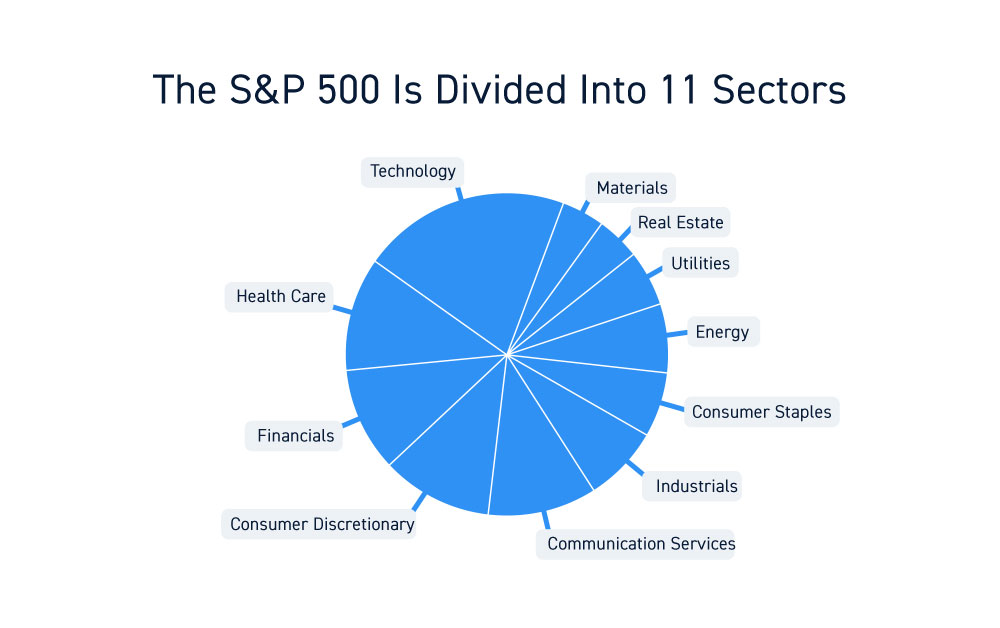
One of the S&P 500’s most significant roles is its function as a leading economic indicator. Because it tracks 500 of the largest and most influential companies across diverse sectors—from technology and finance to healthcare and consumer staples—its performance often reflects the overall health and sentiment of the U.S. economy. A rising S&P 500 generally signals economic expansion, corporate profitability, and investor optimism, while a falling index can indicate economic contraction or recessionary fears. News reports frequently cite the S&P 500’s daily movements as a shorthand for the day’s economic mood, making it a critical data point for anyone tracking financial markets.
A Go-To Performance Benchmark
For professional money managers and individual investors alike, the S&P 500 serves as the gold standard for evaluating investment performance. When a mutual fund or an individual investor claims to have “beaten the market,” they are almost invariably referring to outperforming the S&P 500 over a specific period. This benchmark provides a standardized, easily accessible measure against which to compare the returns of actively managed portfolios, exchange-traded funds (ETFs), or even individual stock selections. Its widespread acceptance makes it an unbiased and reliable yardstick for assessing whether an investment strategy is generating superior returns relative to a broad market exposure.
Accessing the S&P 500: Investment Vehicles

Given that one cannot directly invest in the index itself, how do investors gain exposure to the S&P 500? The most common and accessible methods are through S&P 500 index funds and ETFs. These investment vehicles pool money from numerous investors to purchase shares of all, or a representative sample of, the 500 companies in the index, in the same proportions as their market capitalization. Popular S&P 500 ETFs include SPDR S&P 500 ETF Trust (SPY), iShares Core S&P 500 (IVV), and Vanguard S&P 500 ETF (VOO). These funds offer investors broad diversification across large-cap U.S. equities, typically at very low expense ratios, making them a cornerstone of many long-term investment strategies. By owning such a fund, an investor effectively holds a small piece of 500 major American companies.
Historical Performance and Long-Term Trends
The S&P 500’s history is characterized by remarkable long-term growth, punctuated by periods of significant volatility. Understanding these patterns is crucial for any investor considering an S&P 500-based strategy.
Decades of Growth and Volatility
Over the many decades since its inception, the S&P 500 has delivered an average annual return (including dividends) of approximately 10-12%. This long-term trend of upward growth highlights the power of compounding and the resilience of the U.S. economy. However, this growth has not been linear. The index has experienced numerous bull markets, characterized by sustained price increases, and bear markets, marked by sharp declines. Notable periods of volatility include the dot-com bubble burst in the early 2000s, the 2008 global financial crisis, and the COVID-19 pandemic-induced downturn in 2020. Despite these setbacks, the S&P 500 has historically recovered and reached new highs, demonstrating its long-term growth trajectory for patient investors.
The Role of Diversification
One of the S&P 500’s key strengths is the inherent diversification it offers. By investing in 500 different companies across numerous sectors, investors are not overly reliant on the performance of any single stock or industry. If one company faces challenges or one sector experiences a downturn, the impact is often mitigated by the performance of others within the index. This broad exposure helps to smooth out returns and reduce specific company risk compared to holding a small handful of individual stocks. While it doesn’t eliminate market risk, it significantly reduces idiosyncratic risk, making it a more stable investment than highly concentrated portfolios.
Enduring Relevance in Modern Portfolios
Despite the proliferation of specialized funds and alternative investments, the S&P 500 continues to hold an enduring relevance in modern investment portfolios. For many, it serves as the core “equity allocation” within a diversified portfolio, providing exposure to large-cap U.S. stocks. Its low-cost accessibility through index funds and ETFs makes it an ideal option for long-term investors aiming for market-matching returns without the need for active stock picking. The philosophy behind S&P 500 investing often aligns with passive investment strategies, emphasizing patience, dollar-cost averaging, and trust in the long-term growth of the American economy.
Beyond the Basics: Understanding its Nuances
While the core concept of the S&P 500 is straightforward, there are several nuances that savvy investors should understand to fully appreciate its dynamics and limitations.
Rebalancing and Index Maintenance
The S&P 500 is not a static list of companies. The S&P Dow Jones Indices committee regularly reviews its constituents to ensure they continue to meet the inclusion criteria and that the index remains representative of the market. This involves periodic rebalancing, where companies may be added or removed from the index. For example, a company might be removed if its market capitalization falls significantly below the threshold, if it’s acquired, or if it no longer meets profitability requirements. Conversely, a rapidly growing company that meets all criteria might be added. These changes, while typically announced in advance, can lead to short-term trading activity as index funds adjust their holdings to mirror the new composition.
Dividends and Total Return
When discussing the S&P 500’s performance, it’s vital to differentiate between price return and total return. The price return reflects only the changes in the share prices of the constituent companies. However, many companies within the S&P 500 pay dividends, which are distributions of a portion of a company’s earnings to its shareholders. The total return version of the S&P 500 includes these dividends, assuming they are reinvested back into the index. Over long periods, the reinvestment of dividends significantly boosts overall returns. For instance, while the S&P 500’s average annual price return might be around 8-10%, its total return, including reinvested dividends, has historically been closer to 10-12%. This difference underscores the importance of considering total return when evaluating long-term investment performance.

Limitations and Criticisms
Despite its numerous advantages, the S&P 500 is not without its limitations. One common criticism is its heavy concentration in certain sectors, particularly technology. Due to its market-cap weighting, the performance of a few mega-cap tech giants can disproportionately influence the entire index, potentially masking underperformance in other sectors. Another limitation is its exclusion of smaller, high-growth companies. While the S&P 500 is a superb indicator of large-cap performance, it does not capture the dynamics of the small-cap or mid-cap segments of the market, where different growth opportunities and risks exist. Furthermore, as a passively managed index, it will never “beat” the market; by definition, it is the market for large U.S. stocks. Investors seeking to outperform the S&P 500 would need to engage in active management or invest in strategies that deviate from its composition.
aViewFromTheCave is a participant in the Amazon Services LLC Associates Program, an affiliate advertising program designed to provide a means for sites to earn advertising fees by advertising and linking to Amazon.com. Amazon, the Amazon logo, AmazonSupply, and the AmazonSupply logo are trademarks of Amazon.com, Inc. or its affiliates. As an Amazon Associate we earn affiliate commissions from qualifying purchases.