
In the vast and ever-evolving landscape of technology, data reigns supreme. From optimizing algorithms and fine-tuning machine learning models to ensuring the seamless performance of complex software systems, the ability to interpret and manipulate data is paramount. At the heart of this data-driven world lies a seemingly simple yet profoundly powerful mathematical concept: range. While it may appear as a basic statistical measure, understanding “what is range in mathematics” is not merely an academic exercise; it’s a critical skill for every tech professional looking to extract meaningful insights and build robust, efficient digital solutions.
This article delves into the mathematical definition of range and, more importantly, explores its myriad applications within the tech domain. We’ll uncover how this fundamental concept serves as a cornerstone for data analysis, software engineering, and the cutting-edge fields of artificial intelligence and machine learning, offering practical insights into its calculation and interpretation using modern tech tools.
The Core Concept of Range: Understanding Data Spread
Before we plunge into its technological implications, let’s solidify our understanding of range from a purely mathematical perspective. This foundational knowledge is crucial for appreciating its utility in complex tech scenarios.
Defining Range in Simple Terms
At its most basic, the range of a set of numbers is the difference between the highest and lowest values within that set. It’s a measure of the spread or dispersion of data points. For instance, if you have a dataset of customer support response times (in minutes): [5, 12, 8, 3, 15], the highest value is 15 and the lowest is 3. The range would be 15 – 3 = 12 minutes. This tells us that the total spread of response times observed is 12 minutes.
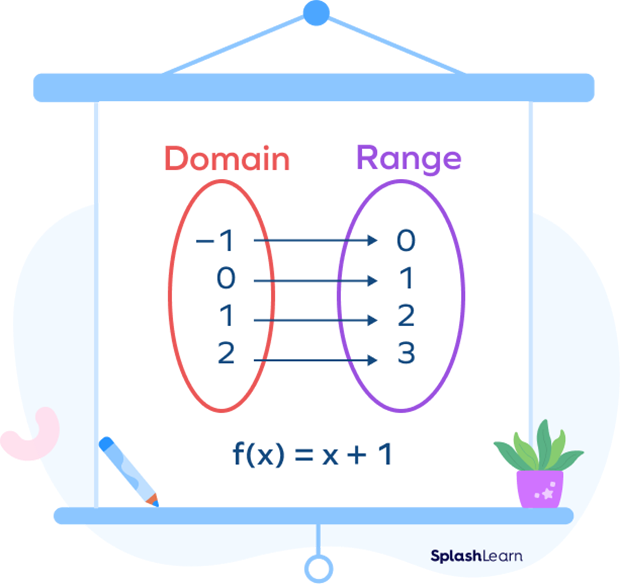
In a slightly more advanced context, particularly in function theory, the range of a function refers to the set of all possible output values (y-values) that the function can produce. For example, for the function f(x) = x², if the domain (input values) is all real numbers, the range is all non-negative real numbers [0, ∞), because a squared number can never be negative. While this functional definition is vital in advanced mathematics, in the context of data analysis and statistics for tech, we primarily refer to the difference between the maximum and minimum values.
Why Spread Matters in Tech: Beyond Averages – Variability is Key
Why bother with range when we have averages like the mean or median? While central tendency measures (mean, median, mode) tell us about the typical value in a dataset, they often don’t tell the whole story. Two datasets can have the same average but wildly different ranges, indicating vastly different levels of variability or consistency.
Consider a tech scenario: two web servers, each reporting an average response time of 100ms.
-
Server A’s response times: [98ms, 102ms, 99ms, 101ms, 100ms]. Range = 4ms.
-
Server B’s response times: [20ms, 180ms, 50ms, 150ms, 100ms]. Range = 160ms.
Both have an average of 100ms. However, Server A is incredibly consistent, with a narrow range of response times. Server B, on the other hand, is highly inconsistent, experiencing both very fast and very slow responses, indicated by its wide range. For a user, Server A offers a predictable experience, while Server B’s unpredictability can be frustrating. This simple example powerfully illustrates why understanding data spread, quantified by range, is crucial in evaluating system performance, user experience, and overall reliability in tech.
Mathematical Foundations for Tech Application: A Quick Refresher for Context
While the calculation of range is straightforward, its implications often tie into broader statistical concepts. Range is the simplest measure of dispersion. Other, more robust measures include the Interquartile Range (IQR), variance, and standard deviation, which we’ll touch upon later. However, the foundational principle – understanding the extent of data variability – starts with range. For tech professionals, this foundational understanding allows for more informed decision-making when monitoring systems, analyzing user behavior, or preparing data for machine learning models.
Range in Data Analysis and Software Engineering
In the day-to-day operations of building and maintaining software, range provides quick, actionable insights that can prevent outages, optimize performance, and enhance user satisfaction.
Performance Metrics and System Monitoring
For DevOps engineers, site reliability engineers (SREs), and network administrators, range is a go-to metric for assessing system health.
-
Network Latency: A narrow range for network latency means consistent connectivity. A wide range could indicate intermittent network congestion or hardware issues.
-
CPU Usage: Monitoring the range of CPU utilization helps identify spikes (max value) or unusual lulls (min value) that might point to inefficient code, resource contention, or idle capacity.
-
Memory Consumption: A tight range in memory usage indicates stable application performance. A wide range could signal memory leaks (increasing max) or inefficient memory allocation.
-
Request Per Second (RPS): Analyzing the range of RPS for an API endpoint can reveal peak load times and periods of minimal activity, aiding in resource provisioning and autoscaling strategies.
Understanding the range of these critical metrics helps teams quickly spot anomalies, identify potential bottlenecks, and ensure systems operate within acceptable performance envelopes.
Quality Assurance and Error Detection
In Quality Assurance (QA) and testing, range is instrumental in defining acceptable thresholds and detecting deviations.
-
Response Time SLAs: Service Level Agreements (SLAs) often specify acceptable response time ranges for software services. QA teams use range to verify that the application consistently meets these expectations.
-
Sensor Data Validation: For IoT devices or embedded systems, range helps validate sensor readings. If a temperature sensor reports data outside a physically possible range (e.g., -500°C to 500°C for ambient temperature), it’s immediately flagged as a faulty reading or a system error.
-
Input Validation: Developers often implement input validation that checks if user inputs fall within an expected range (e.g., age between 0 and 120, quantity between 1 and 1000). This uses the concept of range directly to prevent malformed data from entering the system.
By establishing acceptable ranges for operational parameters and data inputs, engineers can build more resilient software that catches errors early and maintains data integrity.
Data Preprocessing for Software Development
Before data can be used effectively, especially in complex applications or analytical tools, it often needs to be cleaned and prepared. Range plays a role in this crucial preprocessing step.
-
Identifying Outliers: Data points far outside the typical range are often outliers. While not all outliers are errors, a sudden large range in a dataset can indicate the presence of data entry mistakes, measurement errors, or unusual events that need investigation.
-
Data Normalization: For algorithms that are sensitive to the scale of input features, data is often normalized to a specific range (e.g., 0 to 1 or -1 to 1). This ensures that no single feature dominates the learning process due to its larger magnitude.
Range in the Age of AI and Machine Learning
The advent of Artificial Intelligence and Machine Learning has amplified the importance of statistical concepts like range. From preparing data to interpreting model outputs, range is an underlying factor.
Feature Scaling and Normalization
Many machine learning algorithms perform better or converge faster when input features are on a similar scale. This is where range becomes highly relevant.
-
Min-Max Scaling: One common technique, Min-Max Scaling (or normalization), transforms features to a fixed range, typically 0 to 1. The formula involves the minimum and maximum values (i.e., the range) of the feature. This process ensures that features with larger numerical ranges don’t disproportionately influence the model’s learning, allowing algorithms like Support Vector Machines (SVMs) or K-Nearest Neighbors (KNN) to work more effectively.
-
Deep Learning: In neural networks, normalizing input features to a small range (e.g., 0 to 1 or -1 to 1) often aids in stabilizing training and accelerating convergence.
Anomaly Detection and Outlier Identification
Range is a basic, yet effective, tool for anomaly detection, especially when combined with other methods.
-
Setting Thresholds: In supervised anomaly detection, normal behavior can be defined within a specific range. Any data point falling outside this range might be flagged as an anomaly. For example, a credit card transaction amount significantly outside a user’s typical spending range could trigger an alert.
-
Data Drift: Monitoring the range of features over time can help detect data drift, where the statistical properties of the target variable or input features change over time. A sudden expansion or contraction of the range for a critical feature could indicate that the training data is no longer representative of the real-world data the model encounters.

Understanding Model Outputs and Confidence Intervals
While range isn’t directly used for confidence intervals (which typically involve standard deviation and sample size), understanding the spread of model predictions or errors provides context.
-
Prediction Intervals: For regression models, while not strictly “range,” prediction intervals give a range within which a new observation is expected to fall with a certain probability.
-
Error Analysis: Analyzing the range of prediction errors can reveal where a model performs consistently well and where it struggles. A large range of errors suggests the model is highly inconsistent in its predictions.
Practical Application: Calculating Range with Tech Tools
Calculating range is straightforward, and modern tech tools make it even easier, integrating seamlessly into data analysis workflows.
Scripting Range with Python and R
For data scientists and developers, programming languages like Python and R offer direct and efficient ways to compute range.
Python Example:
import numpy as np


data_points = [50, 65, 48, 72, 55, 60, 80, 45, 75]

# Using built-in functions

range_val = max(data_points) - min(data_points)

print(f"Range using built-in functions: {range_val}")


# Using NumPy (common in data science)

numpy_range = np.ptp(data_points) # ptp stands for 'peak-to-peak'

print(f"Range using NumPy: {numpy_range}")
R Example:
data_points <- c(50, 65, 48, 72, 55, 60, 80, 45, 75)


range_val <- max(data_points) - min(data_points)

print(paste("Range:", range_val))


# R also has a range() function that returns min and max, not the difference

min_max_values <- range(data_points)

calculated_range <- min_max_values[2] - min_max_values[1]

print(paste("Calculated Range from min/max:", calculated_range))
These snippets demonstrate how easily range can be integrated into data processing scripts, whether for initial exploratory data analysis (EDA) or for automated monitoring systems.
Leveraging Spreadsheet Software (Excel/Google Sheets)
For quick analysis or less complex datasets, spreadsheet software remains a powerful tool.
- Excel/Google Sheets Formula: To calculate the range for a column of numbers (e.g., A1:A100), you would simply use the formula
=MAX(A1:A100) - MIN(A1:A100).
This accessibility makes range a universally applicable metric, even for non-programmers in tech roles like product managers analyzing user engagement data or marketing specialists tracking campaign performance.
Dashboarding and Visualization
Presenting range effectively in dashboards is crucial for communicating data spread. Tools like Tableau, Power BI, Grafana, and Kibana allow for the visualization of min/max values and derived ranges.
-
Min/Max Lines: Plotting minimum and maximum lines alongside averages on a time-series graph can quickly convey the volatility of a metric.
-
Box Plots: While a box plot visualizes the interquartile range, it also explicitly shows the minimum and maximum values (or values within 1.5 times the IQR), providing a comprehensive view of data spread, including the full range.
-
Summary Tables: Dashboards often include summary tables where range is listed alongside other key performance indicators (KPIs) for quick reference.
Beyond Simple Range: Advanced Variability Measures for Robust Tech Solutions
While simple range is incredibly useful, it has a significant drawback: it is highly sensitive to outliers. A single extreme value can drastically inflate the range, giving a misleading picture of the typical data spread. For more robust analysis, especially in mission-critical tech applications, other measures of dispersion are often employed.
Interquartile Range (IQR): Mitigating Outlier Influence
The Interquartile Range (IQR) is a more robust measure of spread. It’s the range of the middle 50% of the data. To calculate it, you first sort the data and find the first quartile (Q1, the 25th percentile) and the third quartile (Q3, the 75th percentile). The IQR is then Q3 – Q1.
- Tech Relevance: IQR is excellent for identifying typical spread in noisy data or for anomaly detection where you want to ignore extreme outliers. For example, when analyzing user session durations, an IQR would be more representative of most users than a simple range which might be skewed by a few extremely long or short sessions.
Standard Deviation and Variance: A Deeper Dive into Data Dispersion
Variance measures the average of the squared differences from the mean, while Standard Deviation is the square root of the variance. These metrics provide a more nuanced understanding of how individual data points deviate from the mean.
-
Tech Relevance: Standard deviation is widely used for:
-
Statistical Process Control: Monitoring system metrics to ensure they remain within a statistically controlled range.
-
A/B Testing: Determining if differences in performance between two versions are statistically significant.
-
Risk Assessment: Quantifying the volatility or risk associated with different technical strategies or project outcomes.
-
Choosing the Right Metric: Contextual Application in Diverse Tech Scenarios
The choice between range, IQR, standard deviation, or other measures depends heavily on the specific tech context and the nature of the data.
-
Simple Range: Best for quick, initial checks; when all data points are equally important, including potential outliers; or when illustrating the absolute boundaries of a dataset (e.g., min/max response time for an SLA).
-
IQR: Ideal for datasets with outliers where you want a robust measure of the spread of the central data.
-
Standard Deviation/Variance: Preferred for normally distributed data or when a precise understanding of the average deviation from the mean is required, particularly for statistical inference.
A skilled tech professional understands not just how to calculate these metrics, but also when and why to apply each one to gain the most accurate and actionable insights from their data.

Conclusion: Range – An Indispensable Concept in the Tech Ecosystem
The question “what is range in mathematics?” might seem basic, but its answer holds profound implications for the technology sector. Far from being a mere academic curiosity, range is a foundational statistical concept that empowers tech professionals across diverse roles – from data scientists and software engineers to system administrators and product managers – to better understand, analyze, and optimize their digital environments.
Whether it’s for monitoring system performance, ensuring data quality, preparing data for sophisticated AI models, or simply making sense of user behavior, the ability to grasp and apply the concept of range is indispensable. It provides a quick, intuitive snapshot of data variability, offering critical insights into consistency, reliability, and potential anomalies. By leveraging this fundamental tool, and understanding its relationship with more advanced statistical measures, tech innovators can continue to build more robust, efficient, and intelligent systems that shape our digital future.
aViewFromTheCave is a participant in the Amazon Services LLC Associates Program, an affiliate advertising program designed to provide a means for sites to earn advertising fees by advertising and linking to Amazon.com. Amazon, the Amazon logo, AmazonSupply, and the AmazonSupply logo are trademarks of Amazon.com, Inc. or its affiliates. As an Amazon Associate we earn affiliate commissions from qualifying purchases.