
In the rapidly evolving world of technology, data is the undisputed currency of innovation. From powering sophisticated AI algorithms to fine-tuning user experiences and fortifying digital defenses, data forms the bedrock upon which modern tech solutions are built. However, not all data is created equal, nor does it serve the same purpose. Understanding the fundamental distinction between qualitative and quantitative data is not merely an academic exercise; it is a critical skill for anyone involved in software development, AI research, app design, digital security, or technology trends analysis. This article delves into these two pivotal data types, exploring their characteristics, their unique value, and their synergistic application within the tech landscape.

The Foundational Difference: Numbers vs. Narratives
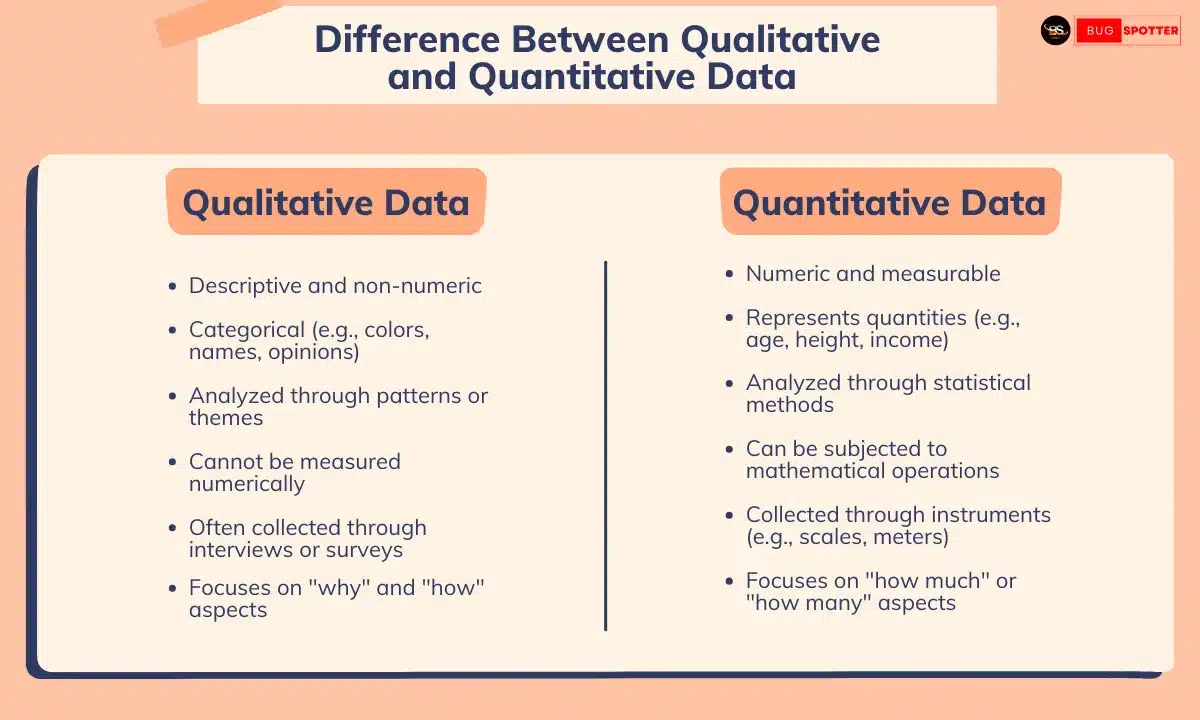
At its core, the distinction between qualitative and quantitative data lies in their very nature: one is about measurement and quantity, while the other is about description and quality. Grasping this fundamental difference is the first step toward effective data utilization in technology.
Quantitative Data: The Realm of Measurable Facts
Quantitative data, as the name suggests, is numerical and measurable. It consists of values that can be counted, measured, or expressed using numbers. This type of data is objective, structured, and lends itself to statistical analysis, allowing for the identification of patterns, averages, and correlations. In technology, quantitative data provides the hard metrics that drive performance, scalability, and efficiency.
Characteristics of Quantitative Data:
-
Numerical: Expressed as numbers (e.g., 50 users, 10 milliseconds, 99.9% uptime).
-
Measurable: Can be counted, ordered, or scaled.
-
Objective: Focuses on facts and statistics, less on interpretation.
-
Statistical Analysis: Easily processed using mathematical and statistical methods to reveal trends, frequencies, and distributions.
-
Reproducible: Often yields consistent results across different measurements.
Examples in Tech:
-
Software Performance Metrics: Load times (in milliseconds), CPU utilization (in percentage), memory consumption (in MB), bug frequency, lines of code.
-
Network Speed and Latency: Download/upload speeds (Mbps), ping times (ms).
-
User Analytics: Number of active users, click-through rates (CTR), conversion rates, session duration, bounce rates, number of app downloads.
-
Security Logs: Number of failed login attempts, volume of network traffic, count of detected malware incidents.
-
Hardware Specifications: Processor speed (GHz), storage capacity (TB), screen resolution (pixels).
Quantitative data answers “how many,” “how much,” “how often,” or “what percentage.” It provides a clear, concise picture of the “what” and “where” in technological phenomena.
Qualitative Data: Unpacking Meaning and Experience
Qualitative data, conversely, is descriptive and non-numerical. It focuses on understanding qualities, characteristics, and meanings rather than quantities. This data type is typically gathered through observations, interviews, open-ended questions, and textual analysis, providing rich, detailed insights into motivations, perceptions, and behaviors. In technology, qualitative data is invaluable for understanding the “why” behind the numbers, humanizing the user experience, and informing design choices.
Characteristics of Qualitative Data:
-
Descriptive: Expressed in words, images, audio, or video.
-
Interpretive: Relies on interpretation and contextual understanding.
-
Subjective: Reflects opinions, feelings, and experiences.
-
Holistic: Aims for a deep, nuanced understanding of a phenomenon.
-
Exploratory: Often used to uncover new problems or understand complex issues.
Examples in Tech:
-
User Feedback: Open-ended comments from surveys, user interview transcripts about app usability, sentiment analysis of social media mentions about a new gadget.
-
Usability Testing Observations: Notes on how users interact with a prototype, their frustrations, or moments of delight.
-
Bug Report Descriptions: Detailed narratives from testers explaining the steps to reproduce an issue, observed symptoms, and perceived impact.
-
Customer Support Interactions: Transcripts of chats or calls revealing user pain points, feature requests, or confusion.
-
UX Research: Persona descriptions, user journey maps, and empathy maps derived from user studies.
-
AI Explainability: Human interpretations of why an AI made a particular decision.
Qualitative data answers “why,” “how,” or “what is the experience like.” It offers context and depth, revealing the human element behind the technical façade.
Why This Distinction Matters in Technology
The ability to differentiate and effectively utilize both qualitative and quantitative data is paramount in the tech industry. Neither type is inherently superior; rather, their combined application yields a more comprehensive and actionable understanding of complex problems.
Fueling AI and Machine Learning Models
The backbone of artificial intelligence and machine learning is data. Understanding its types is crucial for building robust, ethical, and effective models.
-
Quantitative Data for Training: Most supervised learning models thrive on structured, quantitative data. For instance, training a fraud detection AI involves feeding it millions of transaction records (amounts, times, locations) to identify suspicious patterns. Predictive maintenance algorithms use sensor data (temperature, pressure, vibration readings) to forecast equipment failure. Feature engineering often involves transforming raw data into measurable features.
-
Qualitative Data for Refinement and Context: While raw qualitative data isn’t always directly fed into numerical models, it plays a vital role in model development and evaluation. Natural Language Processing (NLP) models, for example, process vast amounts of textual qualitative data (reviews, articles, conversations) to understand sentiment, intent, or topics. Qualitative feedback from users can also identify biases in AI models or point to areas where the model’s performance doesn’t align with real-world human needs, leading to data augmentation or model retraining.
Enhancing User Experience (UX) and Product Development
User experience is a critical differentiator in the competitive tech market. Both data types are indispensable for creating intuitive, engaging, and valuable products.

-
Quantitative UX Metrics: Tools like Google Analytics, Mixpanel, or custom dashboards provide quantitative insights into user behavior: how many users clicked a button, the average time spent on a page, conversion rates through a sales funnel. A/B testing platforms rigorously measure which design variation (e.g., button color, layout) leads to a statistically significant improvement in user engagement or conversion.
-
Qualitative UX Insights: User interviews, usability tests, and focus groups provide the “why” behind the numbers. If quantitative data shows a high bounce rate on a certain page, qualitative research can uncover why users are leaving – perhaps confusing navigation, unclear content, or performance issues. Session recordings, a blend of qualitative observation and quantitative logging, allow researchers to see actual user journeys and identify pain points firsthand. This data is crucial for persona development, user journey mapping, and identifying unmet user needs.
Securing Digital Systems
In the realm of digital security, data is the primary weapon against threats. Both types contribute to a holistic security posture.
-
Quantitative Security Metrics: Security Information and Event Management (SIEM) systems continuously collect vast amounts of quantitative data: number of login attempts, network traffic volume (bytes/second), firewall block counts, vulnerability scan scores, frequency of specific threat alerts. This data allows security analysts to detect anomalies (e.g., sudden spikes in traffic, unusual login patterns), measure incident response times, and quantify risk levels.
-
Qualitative Threat Intelligence: Understanding the motivations, tactics, and procedures (TTPs) of threat actors often relies on qualitative intelligence. Open-source intelligence (OSINT), dark web monitoring, and reports from human intelligence sources provide narrative descriptions of new attack vectors, phishing campaign themes, or social engineering techniques. Post-incident forensics also involves collecting qualitative data: witness accounts, attacker communications, and human analysis of log patterns to reconstruct the narrative of a breach.
Practical Applications Across Tech Disciplines
Let’s look at more specific examples of how qualitative and quantitative data are applied across various tech roles and disciplines.
Software Development and Performance Optimization
Software development is inherently data-driven. From initial concept to deployment and maintenance, data guides every decision.
-
Quantitative Data: Developers monitor KPIs (Key Performance Indicators) like system uptime, API response times, crash rates, and build success rates. Code quality tools provide metrics on complexity, test coverage (percentage), and cyclomatic complexity. A/B testing different features or algorithms is a quantitative method to determine which performs better for users or system resources.
-
Qualitative Data: Bug reports, especially detailed ones from QA testers, are rich qualitative data sources, describing the exact steps to reproduce an error and its observed symptoms. User stories and requirements documents, often derived from qualitative user research, articulate what users need and why, guiding feature development. Internal team feedback on development processes (e.g., during retrospectives) is also qualitative.
AI and Data Science
This field is perhaps the most data-intensive, with both data types playing critical, often intertwined, roles.
-
Quantitative Data: The vast majority of machine learning models are trained on numerical datasets. For instance, training a recommender system involves quantitative data on user ratings, purchase history, and product features. Data scientists perform extensive statistical analysis on quantitative data for feature selection, model evaluation (e.g., accuracy scores, precision, recall), and hyperparameter tuning.
-
Qualitative Data: Data labeling for supervised learning often involves human annotators providing qualitative assessments (e.g., “this image contains a cat,” “this sentence expresses positive sentiment”). Active learning strategies might involve human review of uncertain model predictions. Explainable AI (XAI) efforts often produce qualitative explanations for model decisions, making complex black-box models more understandable to humans. Sentiment analysis, a key AI application, directly processes qualitative text to extract quantitative sentiment scores.
App Design and User Research
Designing successful apps requires a deep understanding of users, a domain where both data types shine.
-
Quantitative Data: App analytics platforms track user flows, screen views, in-app purchases, retention rates, and uninstalls. Heatmaps and click maps show where users interact most on a screen (quantitative intensity). A/B tests on app onboarding flows or feature placements measure their impact on conversion or engagement metrics.
-
Qualitative Data: User interviews and focus groups uncover motivations for using an app, pain points, desired features, and overall satisfaction. Usability testing sessions provide direct observation of user interaction, identifying areas of confusion or delight. App store reviews and support tickets offer unsolicited qualitative feedback, revealing common frustrations or unexpected use cases. Personas, often built on a combination of demographic (quantitative) and behavioral (qualitative) data, guide design decisions.
Integrating Both for Holistic Tech Insights
The real power of data in technology emerges when qualitative and quantitative insights are combined. This mixed-methods approach provides a 360-degree view, moving beyond isolated facts to a comprehensive understanding.
The Power of Mixed Methods in Tech Research
A common pattern in tech research involves starting with quantitative data to identify “what” is happening, and then using qualitative data to understand “why.”
-
Example 1: Declining App Engagement: Quantitative analytics show a sharp drop in user engagement for a specific app feature. This “what” prompts the next step. Qualitative user interviews and usability tests reveal “why”: users find the feature too complex, its benefits unclear, or it’s simply buggy. This combined insight allows developers to redesign the feature effectively.
-
Example 2: Website Conversion Rates: Quantitative A/B testing shows that a new website landing page has a lower conversion rate than the old one. Instead of reverting, qualitative eye-tracking studies and user feedback sessions expose that the new page’s key call-to-action is below the fold, or the imagery is distracting.
-
Example 3: System Security Anomaly: Quantitative log data shows an unusual spike in network traffic from an unexpected IP address. This anomaly triggers an investigation. Qualitative threat intelligence reports suggest this IP is associated with a known APT group using a specific attack pattern, providing context for the quantitative alert and informing the appropriate defensive actions.
From Raw Data to Actionable Intelligence
Ultimately, the goal in tech is to transform raw data into actionable intelligence that drives better decision-making.
-
Data-Driven Design: Product managers and designers combine quantitative data (e.g., frequency of feature usage) with qualitative data (e.g., user complaints about feature usability) to prioritize redesign efforts and new feature development.
-
Personalized Experiences: While quantitative user data (browsing history, purchase patterns) fuels recommendation engines, qualitative insights (e.g., expressed preferences, feedback on recommendations) can refine personalization algorithms, making them more human-centric.
-
Strategic Planning: Tech companies use market research that combines quantitative surveys (market size, demographic reach) with qualitative focus groups (consumer preferences, emerging trends) to inform long-term product roadmaps and investment strategies.
Conclusion
In the dynamic landscape of technology, understanding “what is qualitative and quantitative data” is not just theoretical knowledge but a practical imperative. Quantitative data provides the measurable facts, the benchmarks, and the scale that underpin performance and efficiency. Qualitative data offers the narratives, the experiences, and the deeper meanings that humanize technology and drive true innovation. By mastering the art of collecting, analyzing, and synthesizing both types of data, tech professionals can build more intuitive software, develop more intelligent AI, design more engaging apps, and secure digital systems more effectively, ultimately shaping a future where technology truly understands and serves humanity. The synergy between numbers and narratives is the key to unlocking the full potential of data in the tech revolution.
aViewFromTheCave is a participant in the Amazon Services LLC Associates Program, an affiliate advertising program designed to provide a means for sites to earn advertising fees by advertising and linking to Amazon.com. Amazon, the Amazon logo, AmazonSupply, and the AmazonSupply logo are trademarks of Amazon.com, Inc. or its affiliates. As an Amazon Associate we earn affiliate commissions from qualifying purchases.