
The price-to-book (P/B) value ratio is a fundamental financial metric used by investors to evaluate a company’s stock by comparing its current market price per share to its book value per share. It’s a critical tool in value investing, offering insights into whether a stock might be undervalued or overvalued relative to the company’s net assets. Understanding this ratio is essential for anyone looking to make informed decisions in the stock market, providing a snapshot of how the market values a company’s assets.
Understanding the Basics of Price-to-Book (P/B) Ratio
At its core, the P/B ratio is a valuation multiple that helps investors gauge the market’s perception of a company’s value against its accounting value. It’s a straightforward calculation that can reveal much about a company’s financial standing and potential future prospects.

Defining Book Value
Book value, also known as shareholder equity, represents the total value of a company’s assets that shareholders would theoretically receive if the company were liquidated. It’s derived directly from the company’s balance sheet. The calculation for book value is:
Book Value = Total Assets – Total Liabilities
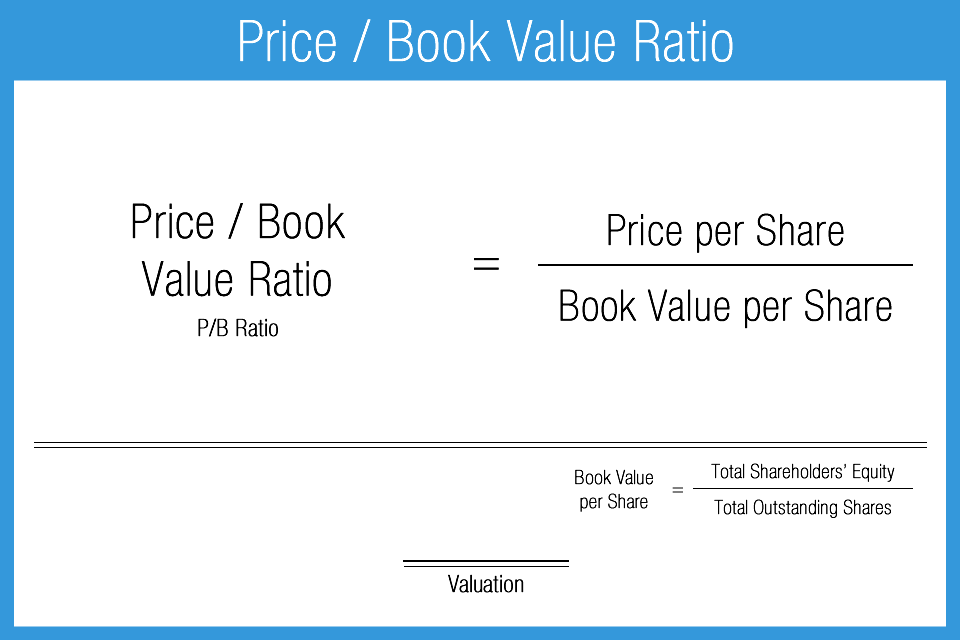
This figure reflects the historical cost of assets, adjusted for depreciation, and reduced by all outstanding liabilities. When calculating the book value per share, you simply divide the total book value by the number of outstanding shares:
Book Value Per Share = Total Book Value / Number of Outstanding Shares
It’s important to note that book value does not necessarily reflect the current market value of a company’s assets, especially for assets like real estate or intellectual property, which may have appreciated significantly or might be valued differently by the market. However, it provides a foundational measure of the company’s net asset backing.
Defining Market Price
The market price refers to the current trading price of a company’s stock on the open market. This price is determined by supply and demand dynamics, reflecting investor sentiment, expectations for future earnings, economic conditions, and various other market forces. Unlike book value, which is based on historical accounting data, the market price is a real-time indicator of what investors are willing to pay for a share of the company right now.
The Formula Explained
With both book value per share and market price per share defined, the P/B ratio formula becomes clear:
Price-to-Book (P/B) Ratio = Market Price Per Share / Book Value Per Share
A high P/B ratio generally suggests that investors are willing to pay more for each dollar of assets than the book value indicates. This often happens with companies that have strong growth prospects, valuable intangible assets not fully captured on the balance sheet, or a strong competitive advantage. Conversely, a low P/B ratio might suggest that a company is undervalued by the market or that the market perceives significant risks or poor future prospects for the company.
Why Investors Use the P/B Ratio
The P/B ratio is not just a theoretical concept; it’s a practical tool that serves several key purposes for investors, particularly those focused on value investing principles.
Identifying Undervalued Stocks
One of the primary uses of the P/B ratio is to identify potentially undervalued stocks. If a company’s market price per share is significantly lower than its book value per share (i.e., a P/B ratio less than 1), it could indicate that the market is not fully appreciating the value of the company’s assets. Value investors often seek out such opportunities, believing that the market will eventually correct itself, driving the stock price up to reflect its intrinsic value. However, a low P/B can also signal underlying problems within the company, making further due diligence crucial.
Assessing Financial Health and Asset Backing
The P/B ratio provides a quick snapshot of how much of a company’s market value is backed by its physical assets. Companies with strong asset bases, such as manufacturing firms, utilities, or banks, often have P/B ratios closer to 1 or slightly above. For these asset-heavy businesses, a P/B ratio significantly below 1 might suggest that the market has lost confidence in the company’s ability to generate future profits from its assets, or it might be indicative of distress. A higher P/B ratio, especially for a company without significant physical assets, signals that investors are valuing the company based on its future earning potential, brand, or intellectual property.
Comparing Companies within an Industry
The P/B ratio is particularly effective when used for comparative analysis within the same industry. Different industries have different asset structures and growth potentials, making direct comparisons across sectors less meaningful. For example, a tech company might consistently have a much higher P/B ratio than a utility company, even if both are considered healthy investments. This is because tech companies often have fewer physical assets but greater growth potential and valuable intangible assets (like software patents or brand equity) that aren’t fully reflected in their book value. By comparing companies within the same sector, investors can identify peers that appear relatively undervalued or overvalued based on their asset backing.
Interpreting P/B Ratios: What Do the Numbers Mean?
Interpreting the P/B ratio is not a one-size-fits-all exercise. The “right” P/B ratio varies significantly depending on the industry, company-specific factors, and the overall economic environment.
Low P/B Ratio: A Sign of Value or Trouble?
A P/B ratio below 1 suggests that the market price is less than the company’s book value. This can be a double-edged sword. On one hand, it could indicate that the stock is undervalued, presenting a compelling opportunity for value investors. The market might be overly pessimistic, or there might be temporary challenges that have depressed the stock price. If the company is fundamentally sound and expected to recover, buying at a P/B less than 1 could yield substantial returns.
On the other hand, a low P/B ratio can also signal severe problems. It might mean the company’s assets are impaired, its earnings power is weak or declining, or it faces significant financial distress (e.g., bankruptcy risk). In such cases, the market correctly discounts the stock because the underlying assets might not be worth their book value if liquidated, or the company might continue to perform poorly. Therefore, a low P/B ratio should always trigger further investigation into the company’s financial health, management quality, industry outlook, and competitive landscape.
High P/B Ratio: Growth Potential or Overvaluation?
A high P/B ratio (significantly greater than 1) implies that investors are willing to pay a premium for the company’s assets. This typically suggests that the market expects strong future growth, high profitability, or that the company possesses valuable intangible assets not captured on its balance sheet. Growth companies, especially in sectors like technology or pharmaceuticals, often command high P/B ratios because their primary value drivers are future innovations, intellectual property, and market leadership rather than current physical assets.
However, a very high P/B ratio can also indicate that a stock is overvalued. If the market’s growth expectations are overly optimistic and the company fails to deliver, the stock price could correct sharply. Investors must assess whether the premium is justified by the company’s sustainable competitive advantages, future earnings potential, and operational efficiency. A company consistently generating high returns on equity (ROE) may justify a higher P/B multiple, as it demonstrates its ability to generate significant profits from its asset base.
Context is King: Industry Benchmarks and Company Specifics
The interpretability of the P/B ratio heavily relies on context. It’s crucial to compare a company’s P/B ratio to:
- Its historical P/B ratio: How does the current ratio compare to its own average over the past 5-10 years? This can indicate whether the stock is currently expensive or cheap relative to its own history.
- Industry average P/B ratio: Different industries have different asset intensities and growth profiles. A P/B of 5 might be normal for a software company but alarmingly high for a steel manufacturer. Comparing against industry peers helps set a realistic benchmark.
- Competitor P/B ratios: How does the company stack up against its direct competitors? This can reveal market sentiment about its relative strengths and weaknesses within its niche.
Furthermore, factors like the company’s debt levels, profitability (e.g., Return on Equity), and growth prospects must always be considered alongside the P/B ratio. A company with a high P/B might be a good investment if it also has high ROE and strong growth, indicating that it is effectively utilizing its assets to generate value.
Limitations and Considerations When Using P/B
While a valuable tool, the P/B ratio has limitations that investors must be aware of to avoid misleading conclusions.
Intangible Assets and Their Impact
One of the most significant limitations of the P/B ratio is its treatment of intangible assets. Book value is based on accounting principles, which often record intangible assets like brand value, patents, copyrights, software, customer lists, and intellectual property at their historical cost or not at all (if internally generated). These assets, however, can be crucial drivers of a company’s market value and future earnings power, especially for modern businesses in tech, pharmaceuticals, or consumer goods.
A company with a powerful brand or groundbreaking technology might have a relatively low book value but a very high market capitalization, leading to a high P/B ratio. In such cases, a high P/B isn’t necessarily a sign of overvaluation but rather a reflection of the market valuing these unquantifiable (or under-quantified) assets. For these types of companies, the P/B ratio alone may not paint a complete picture of their true worth.
Accounting Practices and Distortions
Accounting practices can significantly distort the book value, thereby affecting the P/B ratio’s reliability. Different depreciation methods, inventory valuation techniques, and asset revaluation policies can lead to varying book values for similar assets across different companies or over time. For instance, aggressive depreciation methods can artificially lower book value, making the P/B ratio appear higher.
Furthermore, companies that have made significant acquisitions may have “goodwill” on their balance sheets, which is the premium paid over the fair value of identifiable net assets acquired. Goodwill is an intangible asset that inflates book value but doesn’t necessarily represent a tangible asset that can be easily liquidated. Impairment charges on goodwill or other assets can also dramatically alter book value.
Not Suitable for All Industries or Companies
The P/B ratio is most effective for asset-heavy industries, such as manufacturing, financial institutions, utilities, and real estate, where physical assets are a substantial component of a company’s value. For these sectors, book value often serves as a reasonable approximation of intrinsic value or liquidation value.
However, for asset-light industries or service-oriented companies that rely heavily on human capital, intellectual property, or brand equity (e.g., software companies, consulting firms, advertising agencies), the P/B ratio is often less relevant. These companies may have very few tangible assets but generate substantial earnings, leading to extremely high P/B ratios that don’t necessarily indicate overvaluation. For such companies, other valuation metrics like the price-to-earnings (P/E) ratio or enterprise value to EBITDA might be more appropriate.
How to Integrate P/B into Your Investment Strategy
The P/B ratio is a powerful tool, but like any single metric, it should not be used in isolation. Effective investors integrate P/B into a broader framework of analysis.
Combining P/B with Other Valuation Metrics
To gain a comprehensive understanding of a company’s valuation, it’s crucial to use the P/B ratio in conjunction with other financial metrics. Commonly used ratios include:
- Price-to-Earnings (P/E) Ratio: Compares market price per share to earnings per share. While P/B focuses on assets, P/E focuses on profitability. A low P/B combined with a low P/E can be a strong signal of an undervalued company, often referred to as a “value trap” if not analyzed further.
- Price-to-Sales (P/S) Ratio: Relates market capitalization to total sales. Useful for companies with volatile or negative earnings, or those in early growth stages.
- Dividend Yield: Indicates the dividend payment relative to the stock price. Companies with stable assets and consistent earnings often pay dividends, making this relevant for income-focused investors.
- Enterprise Value to EBITDA (EV/EBITDA): A more comprehensive valuation multiple that considers debt and cash, often used for comparing companies with different capital structures.
By cross-referencing these ratios, investors can build a more robust picture of a company’s financial health and valuation, mitigating the weaknesses of relying on a single metric.
The Role of Growth and Profitability
A company’s growth prospects and profitability are critical factors that influence its P/B ratio. A company with a high P/B ratio might be justifiable if it has strong, consistent earnings growth and a high return on equity (ROE). ROE measures how much profit a company generates for each dollar of shareholder equity and is directly related to the P/B ratio. A higher ROE often correlates with a higher P/B ratio, as investors are willing to pay more for a company that can efficiently generate returns from its assets.
Conversely, a company with a low P/B ratio but declining profitability or negative growth might be a poor investment, even if it appears “cheap.” The market might be accurately discounting its future prospects. Therefore, always analyze the P/B ratio in the context of a company’s historical and projected growth rates, as well as its profitability metrics.

Due Diligence Beyond the Numbers
Finally, successful investing requires going beyond just the numbers. While the P/B ratio provides quantitative insights, qualitative factors are equally important. This includes:
- Management Quality: Assess the competence, integrity, and strategic vision of the management team.
- Competitive Advantage (Moat): Understand the company’s sustainable competitive advantages, such as brand power, patent protection, network effects, or cost leadership.
- Industry Trends: Evaluate the overall health and future outlook of the industry in which the company operates.
- Macroeconomic Factors: Consider broader economic conditions, interest rates, and regulatory environments that could impact the company’s performance.
By integrating the P/B ratio into a holistic investment strategy that combines quantitative analysis with thorough qualitative due diligence, investors can significantly improve their chances of identifying genuinely undervalued opportunities and making sound investment decisions.
aViewFromTheCave is a participant in the Amazon Services LLC Associates Program, an affiliate advertising program designed to provide a means for sites to earn advertising fees by advertising and linking to Amazon.com. Amazon, the Amazon logo, AmazonSupply, and the AmazonSupply logo are trademarks of Amazon.com, Inc. or its affiliates. As an Amazon Associate we earn affiliate commissions from qualifying purchases.