
In the vast and often complex world of investing, discerning the true worth of a company is a challenge that has captivated investors for centuries. Among the myriad financial metrics available, the Price-to-Earnings (P/E) ratio stands out as one of the most widely recognized and frequently discussed valuation tools. For both seasoned investors and curious newcomers, understanding “what is P/E value” is not merely about memorizing a formula; it’s about gaining a crucial insight into how the market perceives a company’s earnings power and future prospects.
The P/E ratio acts as a snapshot, providing a quick assessment of whether a stock is overvalued, undervalued, or fairly priced relative to its earnings. It’s a common language spoken across boardrooms and individual brokerage accounts, a vital sign that can help guide investment decisions. However, like any powerful tool, its utility is maximized only when its nuances, strengths, and limitations are fully appreciated. This comprehensive guide will demystify the P/E value, exploring its calculation, significance, variations, and how to effectively integrate it into a robust investment strategy, ensuring you can leverage this metric to make more informed and strategic financial choices.
Understanding the Core Concept: The P/E Ratio Explained
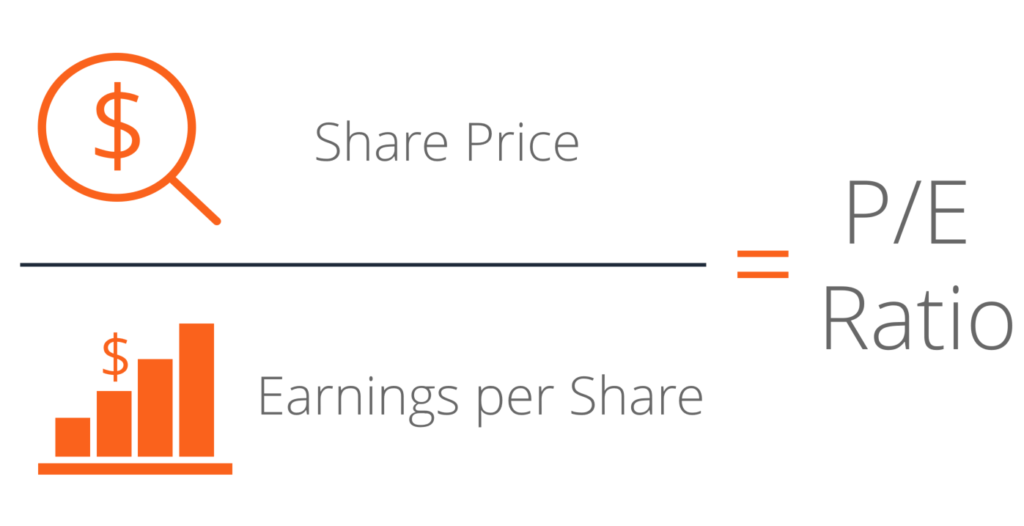
At its heart, the P/E ratio is a simple yet profound measure that helps investors gauge the value they are getting for each dollar of a company’s earnings. It provides a direct link between a company’s market price and its profitability, serving as a critical indicator of market sentiment and expectations.
What P/E Stands For: Price and Earnings
To fully grasp the P/E ratio, it’s essential to break down its two constituent parts: Price and Earnings.
-
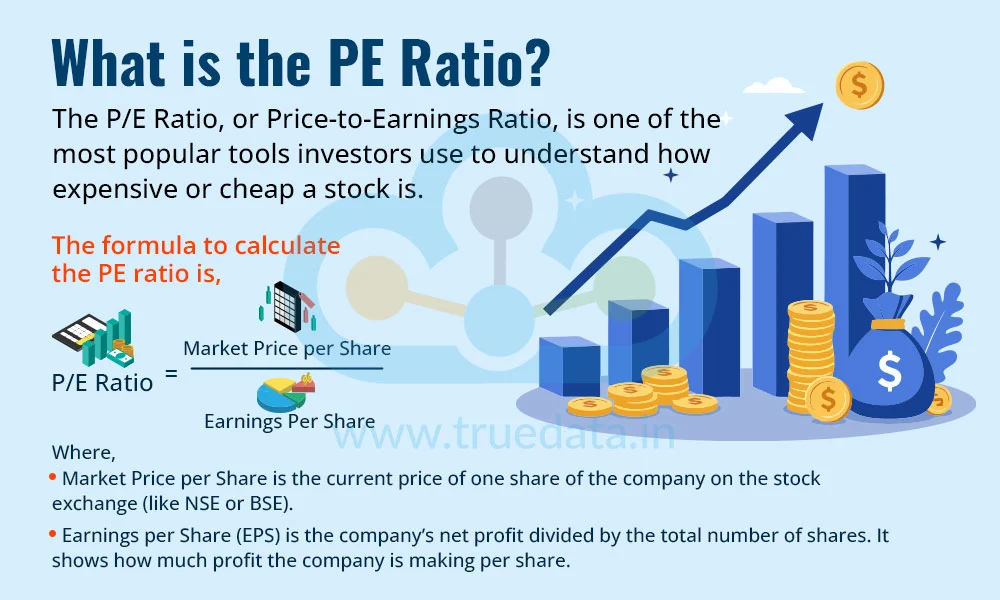
Price per Share (P): This refers to the current market price of one share of the company’s stock. It is the real-time value at which investors are willing to buy or sell a piece of the company on the stock exchange. The price per share reflects countless factors, including supply and demand, recent company news, broader market sentiment, and analyst expectations. It’s a dynamic figure that fluctuates throughout trading hours.
-
Earnings per Share (E): Earnings per share, often abbreviated as EPS, represents the portion of a company’s profit allocated to each outstanding share of common stock. It is calculated by dividing the company’s net income (profit) by the total number of its outstanding shares. EPS is a fundamental measure of a company’s profitability and is typically reported quarterly and annually. A higher EPS generally indicates a more profitable company from the perspective of an individual shareholder.
The Simple Formula and Its Immediate Meaning
The calculation of the P/E ratio is straightforward, making it accessible even to novice investors:
P/E Ratio = Market Price per Share / Earnings per Share
For example, if a company’s stock trades at $50 per share and its earnings per share for the last year were $5, then its P/E ratio would be 10 ($50 / $5 = 10).
Interpretation: How many times investors are willing to pay for each dollar of a company’s earnings.
The resulting number, the P/E ratio, tells you how much investors are willing to pay for every dollar of the company’s earnings. In our example, a P/E of 10 means investors are willing to pay $10 for every $1 of the company’s annual earnings.
-
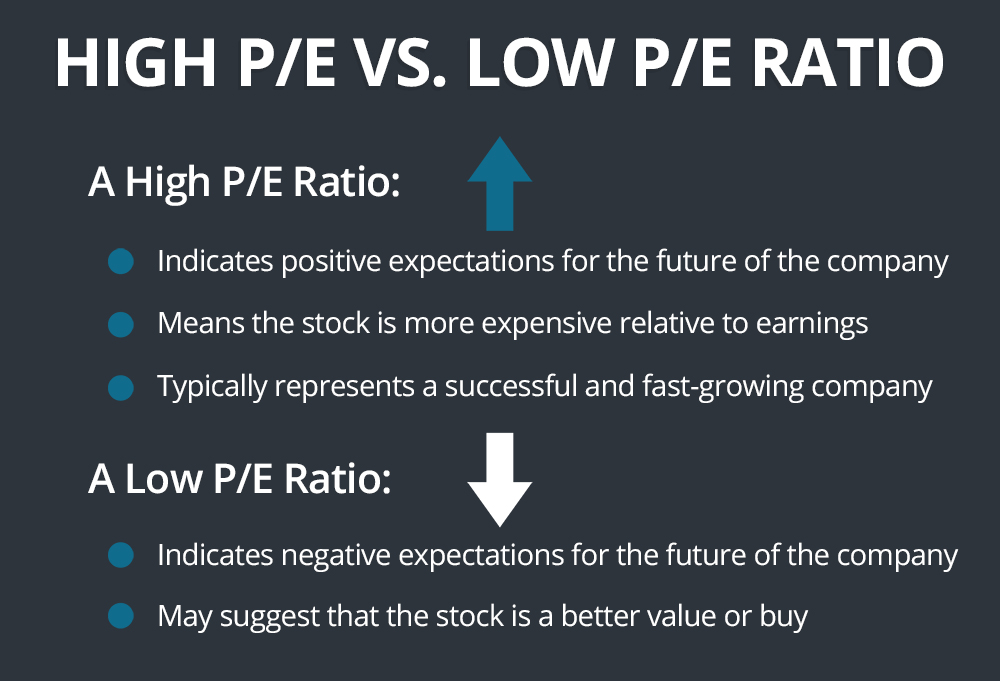
A high P/E ratio typically indicates that investors have high expectations for the company’s future growth. They are willing to pay a premium today for anticipated higher earnings tomorrow. This is often seen in growth stocks or companies in rapidly expanding industries. It could also suggest that a stock is overvalued.
-
A low P/E ratio might suggest that a company is undervalued, has slower growth prospects, or faces significant risks. Value investors often seek out companies with low P/E ratios, believing the market has underestimated their true potential. However, a low P/E can also indicate a company in distress or a mature company with limited growth opportunities.
Understanding this immediate meaning is the first step in unlocking the power of the P/E ratio as a valuation tool.
Why the P/E Ratio Matters: A Key Metric for Investors
The P/E ratio isn’t just an arbitrary number; it’s a window into market psychology and a company’s financial health relative to its peers. Its significance to investors stems from its ability to offer a quick, comparative insight into valuation.
Gauging Investor Sentiment and Valuation
The P/E ratio serves as a powerful barometer of how the market values a company’s earnings. It directly reflects investor sentiment and helps contextualize a stock’s price.
-
High P/E: A high P/E suggests that the market expects significant future earnings growth from the company. Investors are willing to pay a premium today for the promise of higher profitability down the line. This can signify a strong competitive advantage, innovative products, or a dominant market position. However, it also carries the risk of overvaluation; if the company fails to meet these lofty growth expectations, its stock price could fall sharply.
-
Low P/E: Conversely, a low P/E ratio can indicate that the market has a more conservative outlook on a company’s growth prospects, or it may perceive higher risks. For value investors, a low P/E often signals an undervalued stock, a potential “bargain” that could appreciate once the market recognizes its true worth. Yet, it could also be a warning sign, pointing to underlying operational issues, industry headwinds, or a lack of competitive moat.
Comparing Companies Across Industries and Sectors
One of the most valuable applications of the P/E ratio is its ability to facilitate comparisons. It helps investors determine if a stock is cheap or expensive, not in absolute terms, but relative to its peers and its own historical performance.
-
Peer Analysis: Comparing the P/E ratio of a company to that of its direct competitors within the same industry is crucial. For instance, a tech company with a P/E of 30 might seem high in isolation, but if its competitors average a P/E of 40, then it might actually be considered undervalued within its sector.
-
Industry Benchmarks: Different industries inherently have different average P/E ratios due to varying growth rates, capital requirements, and risk profiles. For example, high-growth technology companies often command higher P/Es than mature utility companies. It’s essential to compare a company’s P/E against the industry average rather than a cross-sector average.
-
Historical P/E: Analyzing a company’s current P/E ratio against its own historical average can reveal trends. Is the company currently trading at a higher or lower P/E than its typical range? A P/E significantly above its historical average might signal overenthusiasm, while a P/E below its average could indicate an attractive buying opportunity, assuming the company’s fundamentals haven’t significantly deteriorated.
Identifying Potential Investment Opportunities and Risks
The P/E ratio is a foundational filter that can help investors quickly narrow down their universe of potential investments, identifying both opportunities and red flags.
-
Growth Stocks vs. Value Stocks: Investors generally categorize stocks based on their P/E. Growth stocks typically have high P/E ratios, reflecting expectations of rapid earnings expansion. Value stocks, conversely, often have lower P/E ratios, indicating they may be undervalued relative to their fundamentals. The P/E ratio helps distinguish between these two broad investment strategies.
-
The “Bargain” Fallacy: While a low P/E can suggest an undervalued stock, it’s critical to avoid the “bargain” fallacy. A low P/E might be justified if the company’s earnings are in decline, it faces significant competitive threats, or its industry is obsolete. A low P/E alone does not guarantee a good investment; it merely flags a company for deeper investigation.
By leveraging the P/E ratio in these ways, investors can gain a more nuanced understanding of a company’s market standing and its potential as an investment.
Types of P/E Ratios: Nuances for Deeper Analysis
While the basic P/E formula is simple, the “earnings per share” component can be defined in different ways, leading to various types of P/E ratios. Each offers a distinct perspective, looking either backward at historical performance or forward at future expectations. Understanding these nuances is crucial for a more sophisticated valuation.
Trailing P/E: Looking Backwards
The most common and widely reported P/E ratio is the trailing P/E.
-
Based on past 12 months’ earnings (historical data): The trailing P/E uses the company’s actual earnings per share over the most recent 12-month period. This data is readily available in financial statements and is often displayed on financial news websites.
-
Reliable, but doesn’t reflect future changes: Its primary advantage is its reliance on actual, audited financial data, making it objective and reliable. However, its main drawback is that it’s backward-looking. It doesn’t account for recent changes in a company’s business environment, new product launches, economic shifts, or other factors that might significantly impact future earnings. A company with declining earnings, for example, might still have a high trailing P/E based on a previously strong quarter.
Forward P/E: Glimpsing the Future
To address the limitations of the trailing P/E, analysts and investors often turn to the forward P/E.
-
Based on estimated future earnings (analyst forecasts): The forward P/E uses estimated earnings per share for the next 12 months. These estimates are typically provided by financial analysts who cover the company, taking into account management guidance, industry trends, and economic forecasts.
-
More forward-looking, but subject to forecast inaccuracies: The key benefit of the forward P/E is its forward-looking nature, which can give a better indication of what investors are currently paying for future earnings potential. It’s particularly useful for growth companies where past earnings may not be indicative of rapid future expansion. However, its major weakness is that it relies on projections, which are inherently uncertain. Analyst estimates can be overly optimistic or pessimistic, and actual earnings may deviate significantly from forecasts, rendering the forward P/E misleading.
Shiller P/E (Cyclically Adjusted P/E – CAPE): Smoothing Out the Cycles
For a long-term, macroeconomic view of valuation, the Shiller P/E, also known as the Cyclically Adjusted P/E (CAPE) ratio, offers a more robust perspective.
-
Averaging earnings over 10 years, adjusted for inflation: Developed by Nobel laureate Robert Shiller, the CAPE ratio takes the current stock price and divides it by the average of the company’s (or market’s) earnings over the past 10 years, adjusted for inflation. This long-term average smooths out the effects of business cycles and one-time events that can distort annual earnings.
-
Useful for long-term valuation of entire markets or mature companies: The Shiller P/E is particularly effective for assessing the valuation of entire stock markets (e.g., the S&P 500) or very mature companies, as it provides a more stable and less volatile valuation benchmark. It helps identify periods when the market might be significantly over- or undervalued on a long-term cyclical basis, rather than being swayed by short-term sentiment. While less applicable for individual, high-growth companies, it provides critical context for broader market conditions.
Each type of P/E ratio offers a unique lens through which to view a company’s valuation. Savvy investors often consider all three, combining their insights for a more comprehensive assessment.
Limitations and Complementary Metrics: Beyond Just P/E
While the P/E ratio is a cornerstone of stock valuation, it is not a standalone metric. Relying solely on P/E can lead to incomplete or even misleading conclusions. A nuanced understanding requires acknowledging its limitations and incorporating a broader set of financial tools for a holistic analysis.
When P/E Can Be Misleading
There are several scenarios where the P/E ratio, by itself, can paint an inaccurate picture of a company’s true value or health:
-
Negative or Zero Earnings: If a company is unprofitable (has negative earnings) or has zero earnings, its P/E ratio becomes undefined or meaningless. This is common for startups, companies in heavy investment phases, or those experiencing significant losses. In such cases, other metrics like Price-to-Sales (P/S) or Price-to-Book (P/B) are more appropriate.
-
One-Time Events: Extraordinary items, such as the sale of an asset, a large lawsuit settlement, or a significant write-off, can temporarily inflate or depress earnings for a single period. This can distort the P/E ratio, making a company appear cheaper or more expensive than its underlying operational performance warrants. It’s crucial to examine “normalized” earnings that exclude these non-recurring events.
-
Different Accounting Practices: Companies across different countries or even within the same country can use varying accounting methods (e.g., GAAP vs. IFRS), which can impact how earnings are reported. This makes direct P/E comparisons across international borders or companies with distinct accounting policies challenging.
-
Not Suitable for All Industries: Certain industries, like highly cyclical sectors (e.g., commodities, airlines) or early-stage technology companies that prioritize market share over immediate profits, may not be well-represented by P/E. Their earnings can be extremely volatile or non-existent, making P/E less reliable for valuation.
What Else to Consider: A Holistic Approach
To overcome the P/E ratio’s limitations and gain a truly comprehensive understanding of a company, investors must integrate it with other financial metrics and qualitative factors.
-
Earnings Growth Rate (PEG Ratio): The PEG ratio (P/E to Growth) is a crucial extension of the P/E ratio that accounts for a company’s projected earnings growth. Calculated as P/E Ratio / Annual EPS Growth Rate, it helps investors determine if a high P/E is justified by strong growth prospects. A PEG ratio of 1 or less is often considered favorable.
-
Debt-to-Equity Ratio: This ratio measures a company’s financial leverage, indicating how much debt it uses to finance its assets relative to shareholder equity. A high debt-to-equity ratio suggests higher financial risk, which might make a low P/E less attractive.
-
Price-to-Book Ratio (P/B): The P/B ratio compares a company’s market value to its book value (assets minus liabilities). It’s particularly useful for valuing asset-heavy industries like banking or manufacturing, providing a sense of what investors are paying for the company’s net assets.
-
Price-to-Sales Ratio (P/S): For companies with negative or volatile earnings (e.g., early-stage tech firms), the P/S ratio (Market Cap / Revenue) can be a more relevant valuation metric. It assesses how much investors are paying for each dollar of a company’s sales.
-
Dividend Yield: For income-focused investors, the dividend yield (Annual Dividends per Share / Market Price per Share) indicates the return on investment from dividends alone. It’s often considered alongside P/E for mature, stable companies.
-
Management Quality, Competitive Landscape, Industry Trends: Beyond quantitative metrics, qualitative factors are equally important. Evaluating the strength of the management team, the company’s competitive advantages (its “moat”), and the overall health and future trends of its industry provides essential context that no single ratio can capture.
By adopting a holistic approach that combines the P/E ratio with these complementary metrics and qualitative analyses, investors can make more informed decisions, mitigating the risks inherent in relying on isolated data points.
Strategies for Using P/E in Your Investment Decisions
Effectively integrating the P/E ratio into your investment decision-making process requires more than just knowing the formula; it demands a strategic mindset, a commitment to context, and an understanding of how it fits within a broader due diligence framework.
Context is King: Comparing Apples to Apples
The most critical rule when using the P/E ratio is to always consider it within its proper context. A P/E of 20 might be cheap for a fast-growing software company but incredibly expensive for a slow-growth utility.
-
Industry Averages: Always compare a company’s P/E to the average P/E of its direct competitors and the broader industry. This helps you identify if a stock is relatively overvalued or undervalued within its specific sector.
-
Historical Context: Analyze the company’s current P/E against its own historical P/E range. Is it trading at a premium or discount to its typical valuation? Understand what might be driving any significant deviations.
-
Market Conditions: The overall market P/E can also provide valuable context. During bull markets, P/E ratios across the board tend to be higher, reflecting increased optimism, while bear markets see lower P/Es as investors become more risk-averse.
-
Growth vs. Value Investing Philosophies: Your investment philosophy will dictate how you interpret P/E. Growth investors might tolerate higher P/Es for companies with exceptional growth prospects, while value investors will actively seek out companies with lower P/Es that they believe are trading below their intrinsic value.
The PEG Ratio: P/E in Context of Growth
As highlighted earlier, the PEG ratio is an indispensable tool that refines the P/E analysis by incorporating expected earnings growth.
PEG = P/E Ratio / Annual EPS Growth Rate
-
Adjusting for Growth: The PEG ratio allows for a more “apples-to-apples” comparison between companies with different growth rates. A company with a P/E of 30 and 30% growth is arguably more attractive than a company with a P/E of 15 and only 5% growth.
-
A PEG of 1 often suggests fair valuation: A commonly used heuristic is that a PEG ratio of 1 or less indicates that a stock is fairly valued or potentially undervalued, given its growth prospects. A PEG significantly above 1 might suggest the stock is overvalued, while a PEG well below 1 could signal undervaluation (or skepticism about future growth).
Integrating P/E into Your Due Diligence Process
The P/E ratio should be one of the initial filters in your investment research, not the sole determinant.
-
Start with P/E, then dive deeper: Use the P/E ratio to quickly identify companies that warrant further investigation (e.g., low P/E for potential value, or high P/E with strong growth for potential growth opportunities). Once identified, conduct thorough due diligence that extends beyond P/E.
-
Avoid P/E as a standalone decision-maker: Never make an investment decision based solely on a P/E ratio. Always corroborate your findings with other financial metrics (e.g., P/B, P/S, debt levels, cash flow, profit margins) and qualitative analysis (e.g., management quality, competitive advantages, industry outlook).
-
Long-term Perspective: For long-term investors, focusing on a company’s ability to consistently grow earnings over time is more important than short-term P/E fluctuations. A reasonably valued company with sustainable growth can deliver superior returns over the long haul, even if its P/E isn’t the absolute lowest.
In conclusion, the P/E ratio is an incredibly powerful and versatile tool in the investor’s arsenal. When understood in its various forms, applied within its proper context, and complemented by a comprehensive range of financial and qualitative analyses, it can significantly enhance your ability to identify promising investment opportunities and build a resilient portfolio. Mastering “what is P/E value” is not just about financial literacy; it’s about gaining a strategic edge in the pursuit of your financial goals.
aViewFromTheCave is a participant in the Amazon Services LLC Associates Program, an affiliate advertising program designed to provide a means for sites to earn advertising fees by advertising and linking to Amazon.com. Amazon, the Amazon logo, AmazonSupply, and the AmazonSupply logo are trademarks of Amazon.com, Inc. or its affiliates. As an Amazon Associate we earn affiliate commissions from qualifying purchases.