In the rapidly evolving landscape of artificial intelligence and machine learning, we often find ourselves captivated by the complexity of neural networks, generative AI, and deep learning architectures. However, at the heart of most sophisticated data science workflows lies a fundamental statistical technique that has stood the test of time: Ordinary Least Squares (OLS). As the cornerstone of linear regression, OLS remains one of the most powerful and widely used tools in the technologist’s arsenal for predictive modeling, trend analysis, and data-driven decision-making.
1. The Core Architecture of Ordinary Least Squares
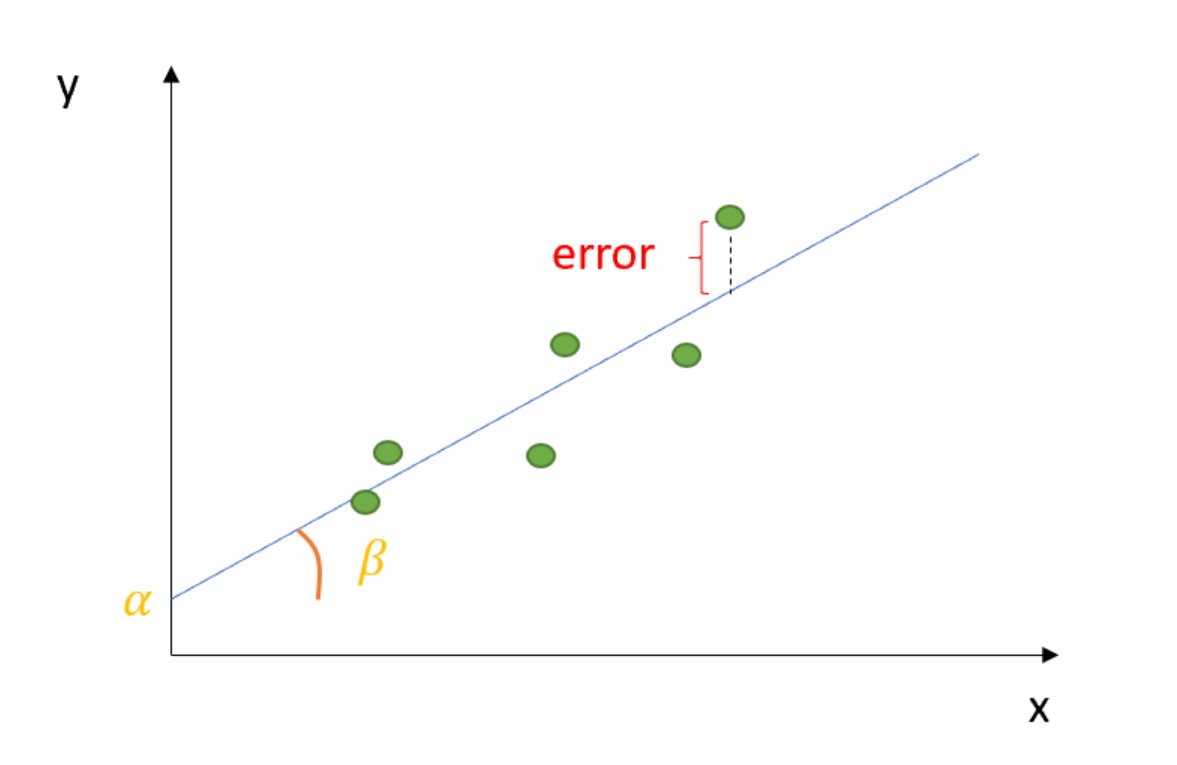
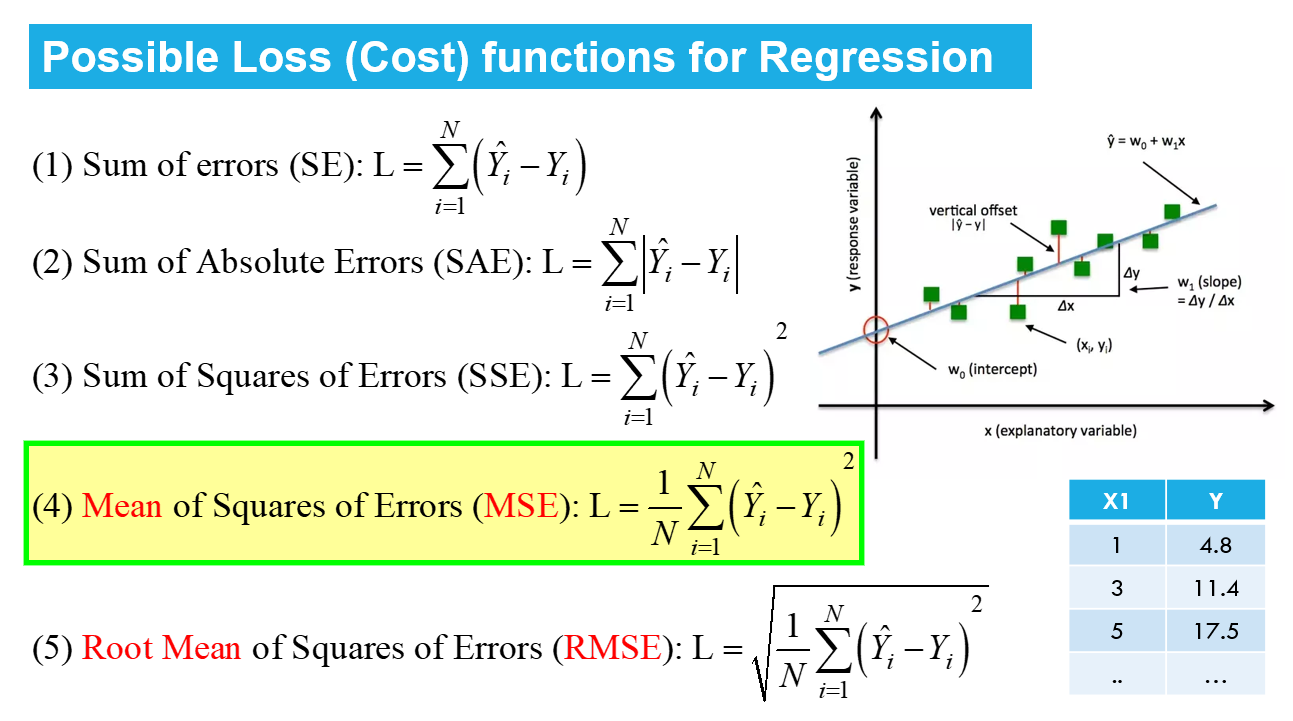
To understand Ordinary Least Squares from a technical perspective, one must first view it as an optimization problem. In the realm of software engineering and data science, OLS is the primary method for estimating the unknown parameters in a linear regression model. Its objective is simple yet profound: to find the “line of best fit” through a set of data points by minimizing the sum of the squares of the vertical deviations (residuals) between each data point and the fitted line.

The Mathematical Foundation
At its technical core, OLS operates on a linear equation: $y = beta0 + beta1x + epsilon$. Here, $y$ represents the dependent variable (the outcome we want to predict), $x$ is the independent variable (the feature), $beta$ represents the coefficients or weights the model must learn, and $epsilon$ is the error term. The “least squares” part of the name refers to the algorithm’s strategy of squaring the distance between the observed data and the predicted value to ensure that negative and positive errors do not cancel each other out, while also penalizing larger outliers more heavily.
From Statistics to Algorithmic Logic
For a software developer or a data scientist, OLS is essentially a minimization function. We are seeking to minimize the Cost Function. By calculating the derivative of the sum of squared residuals and setting it to zero, we can analytically solve for the optimal coefficients. This “closed-form solution” is a significant advantage in tech, as it allows for direct computation without the need for the iterative loops required by more complex algorithms like Gradient Descent—at least when dealing with datasets that fit within a system’s memory.
The Geometric Interpretation
In a multi-dimensional feature space, OLS can be visualized as a projection. We are projecting the vector of observed outcomes onto the subspace spanned by our independent variables. This geometric perspective is crucial when building software that visualizes data trends, as it helps engineers understand how high-dimensional data is flattened into a predictable linear trend.
2. Key Assumptions: Ensuring Model Integrity in Tech Environments
In software development, “garbage in, garbage out” is a foundational principle. Similarly, for an OLS model to produce reliable insights, certain underlying assumptions must be met. If these conditions are violated, the model’s predictive power collapses, leading to biased results or “hallucinations” in the data output.
Linearity and Independence
The most basic assumption is that the relationship between the independent and dependent variables is linear. If a developer attempts to use OLS on a dataset that follows a logarithmic or exponential curve without prior transformation, the model will fail to capture the trend. Furthermore, observations must be independent of one another. In time-series data—common in digital security or system monitoring—this assumption is often challenged by autocorrelation, where past values influence future ones.
Homoscedasticity vs. Heteroscedasticity
A critical concept for data engineers is homoscedasticity, which implies that the “noise” or error in our model is constant across all levels of our independent variables. If the variance of the errors fluctuates—a phenomenon known as heteroscedasticity—the OLS estimator remains unbiased but is no longer the “Best Linear Unbiased Estimator” (BLUE). In practical tech applications, such as predicting server load based on user traffic, heteroscedasticity might suggest that our model becomes less reliable during peak hours.
The Problem of Multicollinearity
In complex software ecosystems with hundreds of telemetry features, we often encounter multicollinearity. This occurs when two or more independent variables are highly correlated (e.g., “CPU usage” and “Power consumption”). For OLS, this makes it difficult to isolate the individual effect of each variable, leading to unstable coefficient estimates. Tech professionals must use techniques like Variance Inflation Factor (VIF) analysis or dimensionality reduction to address this before deploying an OLS-based feature.
3. Implementing OLS within the Modern Tech Stack
In the era of Python-dominant data science, implementing Ordinary Least Squares has transitioned from manual matrix calculus to highly optimized library calls. Understanding where OLS fits into the software development lifecycle (SDLC) is essential for building scalable analytical tools.
Python and the Scikit-Learn Ecosystem
For most developers, the LinearRegression class in the scikit-learn library is the go-to implementation of OLS. Under the hood, scikit-learn uses the LAPACK routine for solving the least squares problem via singular value decomposition (SVD). This is computationally efficient and robust against numerical instabilities. For those requiring a more “statistical” output—including p-values and R-squared summaries—the statsmodels library provides a comprehensive OLS module that mimics the detailed output of R or SAS.
OLS in Big Data and Cloud Computing
While OLS has a closed-form solution (the Normal Equation), calculating $(X^TX)^{-1}$ becomes computationally expensive as the number of features $(n)$ increases, specifically with a complexity of $O(n^3)$. In high-scale tech environments dealing with “Big Data,” engineers often shift from pure OLS to iterative solvers like Stochastic Gradient Descent (SGD) which approximate the OLS solution. Modern cloud platforms like AWS SageMaker or Google Vertex AI offer distributed versions of these solvers to handle petabyte-scale datasets where a single-machine OLS implementation would crash.
Integrating OLS into Automated Pipelines
Modern DevOps and MLOps workflows involve the continuous integration and deployment of models. OLS is often used as a “baseline model” in these pipelines. Because it is computationally “cheap” and highly interpretable, it provides a benchmark against which more complex models (like XGBoost or Neural Networks) are measured. If a complex deep learning model only outperforms a simple OLS regression by 1%, a tech lead might choose the OLS model for its lower latency and ease of maintenance.
4. Practical Applications: From Software Performance to AI Security
Why does OLS remain a staple in the tech industry despite the rise of more “glamorous” AI tools? Its utility spans across various domains of technology, providing clarity where there is noise.
Performance Engineering and Resource Scaling
Infrastructure engineers use OLS to predict system requirements. By analyzing historical data on user growth versus memory consumption, OLS can provide a linear projection of when a startup will need to migrate to a larger cloud instance. This predictive capacity allows for proactive scaling, ensuring that software stays performant as the user base expands.
Digital Security and Anomaly Detection
In the realm of digital security, OLS is used to establish “normal” patterns of behavior. By modeling the typical relationship between network traffic and time of day, security tools can identify outliers. When the actual data point deviates significantly from the OLS-predicted line (a high residual), it triggers an alert for a potential DDoS attack or a data breach.
A/B Testing and Feature Rollouts
Product-led tech companies rely on OLS to interpret the results of A/B tests. When rolling out a new app feature, engineers use regression analysis to control for confounding variables (like user age or device type). OLS allows them to isolate the “treatment effect” of the new feature, providing a clear metric on whether the update actually improved user engagement or was merely a result of random fluctuation.
5. The Future of OLS: Interpretability in an “Opaque” AI Era
As we move deeper into the age of “Black Box” AI, the transparency of Ordinary Least Squares has become its greatest asset. Tech ethics and regulatory compliance (like GDPR) increasingly demand that automated decisions be explainable.
The Interpretability Advantage
Unlike a 100-layer neural network, an OLS model provides a clear coefficient for every input. If a fintech app denies a loan based on a regression model, the developers can point to the specific weight assigned to the user’s credit history. This “Explainable AI” (XAI) is vital for building trust with users and regulators alike. In a world where AI transparency is becoming a legal requirement, OLS serves as the gold standard for interpretable machine learning.
Hybrid Approaches and Regularization
The tech world rarely uses “vanilla” OLS in isolation for high-stakes production. Instead, we see the evolution of OLS into Regularized Linear Models like Ridge and Lasso regression. These techniques add a “penalty” term to the OLS cost function to prevent overfitting—a common issue in software where models perform well on training data but fail in the real world. By shrinking coefficients, these hybrid OLS models maintain the simplicity of linear regression while adding the robustness needed for modern software applications.
Conclusion: The Timeless Tool for Tech
Ordinary Least Squares is far more than a relic of 19th-century mathematics; it is a fundamental pillar of the modern tech stack. From its role in defining the basic logic of predictive algorithms to its implementation in high-scale cloud environments, OLS provides the clarity and efficiency that modern technology demands. For any developer or tech professional, mastering OLS is not just about learning a statistical method—it is about understanding the language of data that powers the digital world. Whether you are benchmarking a new microservice or building a foundational AI model, the “line of best fit” remains your most reliable guide.
aViewFromTheCave is a participant in the Amazon Services LLC Associates Program, an affiliate advertising program designed to provide a means for sites to earn advertising fees by advertising and linking to Amazon.com. Amazon, the Amazon logo, AmazonSupply, and the AmazonSupply logo are trademarks of Amazon.com, Inc. or its affiliates. As an Amazon Associate we earn affiliate commissions from qualifying purchases.