
Navigating the world of mutual funds can feel like deciphering a new language, and at the heart of this lexicon lies a crucial term: Net Asset Value, or NAV. If you’ve ever dabbled in mutual funds, or are considering it, understanding NAV is not just helpful – it’s fundamental to making informed investment decisions. This article, grounded in our expertise across technology, brand, and money, will demystify NAV, explore its implications for your investments, and how it interacts with the broader financial ecosystem.
Mutual funds pool money from many investors to buy a diversified portfolio of securities like stocks, bonds, or other assets. Unlike individual stocks or bonds whose prices fluctuate throughout the trading day, mutual funds, as a whole, are priced only once a day after the market closes. This daily valuation is where NAV comes into play.
Understanding the Mechanics of NAV Calculation
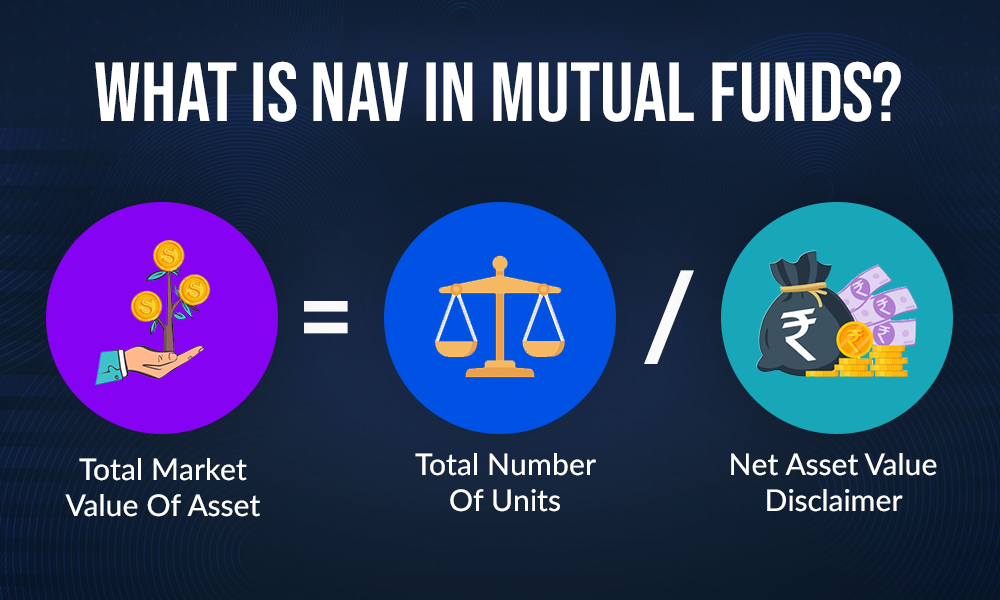
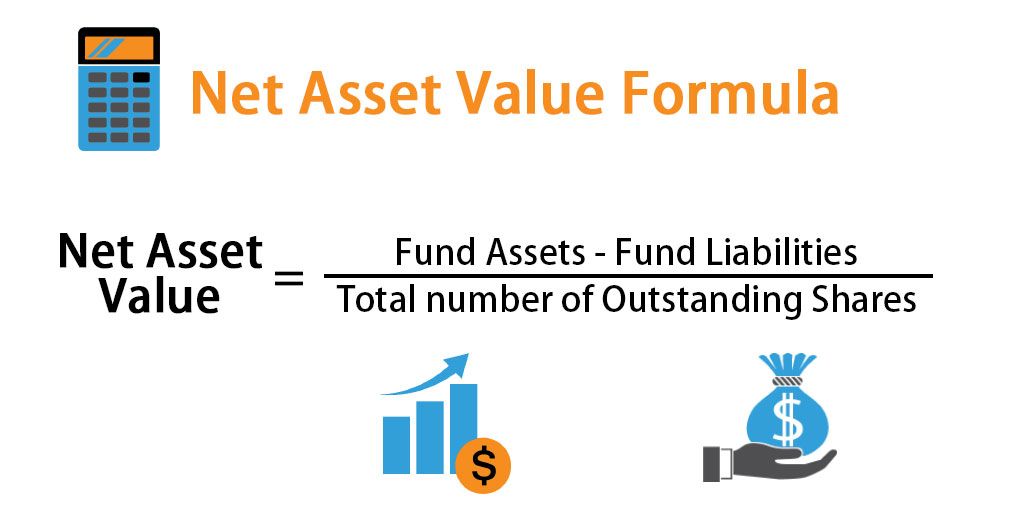
The Net Asset Value (NAV) of a mutual fund represents the per-share market value of the fund. It’s a snapshot of the fund’s worth on a given day, and it’s calculated by taking the total value of all the assets held by the fund, subtracting its liabilities, and then dividing the result by the total number of outstanding shares.
The Formula: A Simple Breakdown
The formula for NAV is straightforward:
NAV = (Total Assets – Total Liabilities) / Total Outstanding Shares
Let’s break down each component:
-
Total Assets: This includes the current market value of all the securities the mutual fund holds – stocks, bonds, cash, money market instruments, and any other investments. It also encompasses accrued income like dividends and interest that the fund expects to receive.
-
Total Liabilities: These are the expenses and obligations the mutual fund owes. This can include management fees, operating expenses, administrative costs, and any other outstanding debts.
-
Total Outstanding Shares: This is the total number of shares of the mutual fund that are currently held by investors.
The calculation is performed at the end of each trading day, typically after the closing bell of the stock exchanges. This means that when you place a buy or sell order for a mutual fund during the day, you don’t get a guaranteed price. Instead, your transaction will be executed at the NAV that is calculated at the end of that business day. This is a key differentiator from individual stocks, which trade at fluctuating prices throughout the day.
Example:
Imagine a mutual fund has the following at the close of a trading day:
- Total Assets: $10,000,000
- Total Liabilities: $500,000
- Total Outstanding Shares: 1,000,000
Using the formula:
NAV = ($10,000,000 – $500,000) / 1,000,000
NAV = $9,500,000 / 1,000,000
NAV = $9.50
So, the Net Asset Value per share for this fund is $9.50. If you were to buy shares of this fund at the end of that day, you would purchase them at $9.50 per share, plus any applicable loads or fees.
Why NAV Matters: Your Investment’s Pulse
The NAV is more than just a number; it’s the primary indicator of a mutual fund’s performance and value. It directly impacts how much you pay to buy units of a fund and how much you receive when you sell them. Understanding its movement provides crucial insights into the health and growth of your investment.
NAV as a Pricing Mechanism
When you decide to invest in a mutual fund, you are essentially buying units or shares of that fund at its current NAV. If the NAV is $10 and you invest $1,000, you will purchase 100 units (excluding any loads or fees). If you decide to redeem your investment later when the NAV has risen to $12, you will receive $1,200 (again, excluding fees). This direct relationship between NAV and your investment value is why tracking its changes is so important.
NAV and Performance: Correlation, Not Causation
It’s a common misconception that a higher NAV automatically means a better-performing fund, or that a fund with a lower NAV is a “bargain.” This is not necessarily true. The NAV reflects the current market value of the fund’s underlying assets. A fund with a high NAV might simply have issued fewer shares, or its underlying assets may have appreciated significantly. Conversely, a fund with a lower NAV might have more shares outstanding or its assets may not have grown as much.
Instead of focusing on the absolute NAV value, investors should concentrate on the percentage change in NAV over time. A fund whose NAV has grown by 10% is performing better than a fund whose NAV has grown by 5%, regardless of their absolute NAV figures.
The Impact of Market Fluctuations on NAV
The NAV of a mutual fund is intrinsically linked to the performance of its underlying assets. If the stocks or bonds held by the fund increase in value, the fund’s total assets rise, leading to an increase in NAV. Conversely, if the market prices of the securities in the fund’s portfolio decline, the total assets decrease, and the NAV falls.
This is why it’s crucial to understand the investment objective and asset allocation of a mutual fund. A fund heavily invested in volatile equities will likely see more dramatic fluctuations in its NAV compared to a fund that holds predominantly stable government bonds.
Factors Influencing NAV Changes
Several factors can cause the NAV of a mutual fund to fluctuate. Understanding these influences helps investors anticipate potential movements and make more strategic investment decisions.
1. Performance of Underlying Assets
This is the most significant driver of NAV changes. The market value of stocks, bonds, and other securities within the fund’s portfolio directly impacts its total asset value. Positive market performance leads to NAV appreciation, while negative performance results in NAV depreciation.
2. Income Distribution and Capital Gains
Mutual funds can generate income through dividends from stocks and interest from bonds. They can also realize capital gains when they sell securities at a profit.
- Income Distributions: Funds often distribute these accrued incomes to investors periodically (e.g., quarterly or annually). When a fund distributes income, its cash asset decreases, which in turn reduces the total asset value, and consequently, the NAV. This is why you’ll often see a slight dip in NAV on the ex-dividend or ex-distribution date.
- Capital Gains Distributions: Similarly, if a fund sells assets for a profit and distributes these capital gains to investors, the NAV will decrease by the amount of the distribution per share.
3. Fund Expenses
As mentioned in the NAV calculation, fund expenses are a crucial component of liabilities. These include management fees (charged by the fund manager), administrative costs, legal fees, marketing expenses, and other operational overhead. These expenses are typically deducted from the fund’s assets on a daily basis, gradually reducing the NAV over time. Even if the underlying assets perform well, high expenses can eat into potential returns and dampen NAV growth.
4. Fund Flows (Purchases and Redemptions)
While not directly a factor in the per-share calculation at the end of the day (as it’s based on existing shares), significant inflows or outflows of money from a fund can have an indirect impact on NAV, especially for larger funds.
- Large Inflows: When many investors buy into a fund, the fund manager has more capital to invest. If this capital is invested quickly and effectively in a rising market, it can contribute to NAV growth. However, if the market is illiquid or the manager struggles to deploy capital efficiently, it could lead to a slight dilution effect, though this is usually minimal.
- Large Redemptions: Conversely, if many investors sell their units, the fund manager might be forced to sell assets to meet redemption requests. If these sales occur during a market downturn, it can exacerbate losses and lead to a more significant drop in NAV.
5. Corporate Actions and Reorganizations
Events affecting the underlying securities of the fund, such as stock splits, mergers, or acquisitions, can also influence the NAV. For example, if a company whose stock is a major holding in the fund undergoes a stock split, the number of shares the fund holds will increase, but the total value of that holding may remain similar initially, potentially affecting the overall NAV.
NAV vs. Market Price: A Crucial Distinction
It’s essential to differentiate NAV from the market price of a fund, especially for a specific type of mutual fund: Exchange-Traded Funds (ETFs). While traditional mutual funds are priced solely by their NAV, ETFs trade on stock exchanges like individual stocks, meaning they have both an NAV and a market price.
Exchange-Traded Funds (ETFs)
ETFs are a hybrid between mutual funds and stocks. They hold a basket of assets that track an index (like the S&P 500), but they trade on exchanges throughout the day.
- NAV for ETFs: ETFs also calculate a daily NAV, representing the intrinsic value of their underlying assets.
- Market Price for ETFs: However, because they trade on exchanges, ETFs have a market price that fluctuates based on supply and demand throughout the trading day.
Ideally, the market price of an ETF should closely track its NAV. However, due to market dynamics, there can be small discrepancies.
- Trading at a Premium: When an ETF’s market price is higher than its NAV, it’s trading at a premium.
- Trading at a Discount: When an ETF’s market price is lower than its NAV, it’s trading at a discount.
These premiums and discounts are typically very small for highly liquid ETFs and are largely arbitrage away by market participants. However, understanding this distinction is vital for ETF investors. For traditional mutual funds, the price you pay or receive is always the end-of-day NAV.

Conclusion: NAV as Your Investment Compass
In the intricate landscape of mutual fund investing, Net Asset Value (NAV) serves as your fundamental compass. It’s the daily barometer of your investment’s worth, dictating the price at which you enter and exit your holdings. While a high NAV doesn’t inherently signify superior performance, understanding its calculation, the factors that influence its movement, and its distinction from market price (especially with ETFs) empowers you to make more informed financial decisions.
By keeping a close eye on the percentage change in NAV, alongside other performance metrics, and considering the underlying asset allocation and expense ratios, you can better gauge the trajectory of your mutual fund investments. In the realm of personal finance and investing, knowledge is indeed power, and mastering the concept of NAV is a significant step towards achieving your financial goals. Remember, consistently tracking and understanding your fund’s NAV is a cornerstone of diligent and successful investing.
aViewFromTheCave is a participant in the Amazon Services LLC Associates Program, an affiliate advertising program designed to provide a means for sites to earn advertising fees by advertising and linking to Amazon.com. Amazon, the Amazon logo, AmazonSupply, and the AmazonSupply logo are trademarks of Amazon.com, Inc. or its affiliates. As an Amazon Associate we earn affiliate commissions from qualifying purchases.