In the vast landscape of computational mathematics and data science, symbols serve as the shorthand for complex operations. Among these, the symbol “Mo” stands as a foundational pillar. In statistics and its various technological applications, “Mo” represents the Mode—the value that appears most frequently in a given set of data. While it may seem like a simple concept from a primary school math class, its implications in modern technology, artificial intelligence, and software engineering are profound.
As we move deeper into the era of Big Data, the ability to identify the “most common” element within a dataset is critical for everything from optimizing user interfaces to training sophisticated machine learning models. This article explores the technical significance of the Mo symbol, its implementation in programming, and its vital role in the current tech ecosystem.
The Fundamentals of Mo in Computational Mathematics
At its core, “Mo” is a measure of central tendency. Unlike the mean (average) or the median (middle value), the mode is the only measure of central tendency that can be used with nominal data—data that is categorized by name rather than numerical value. In the tech world, where we often deal with strings, categories, and tags, the mode becomes a primary tool for analysis.
Defining the Mode in the Digital Age
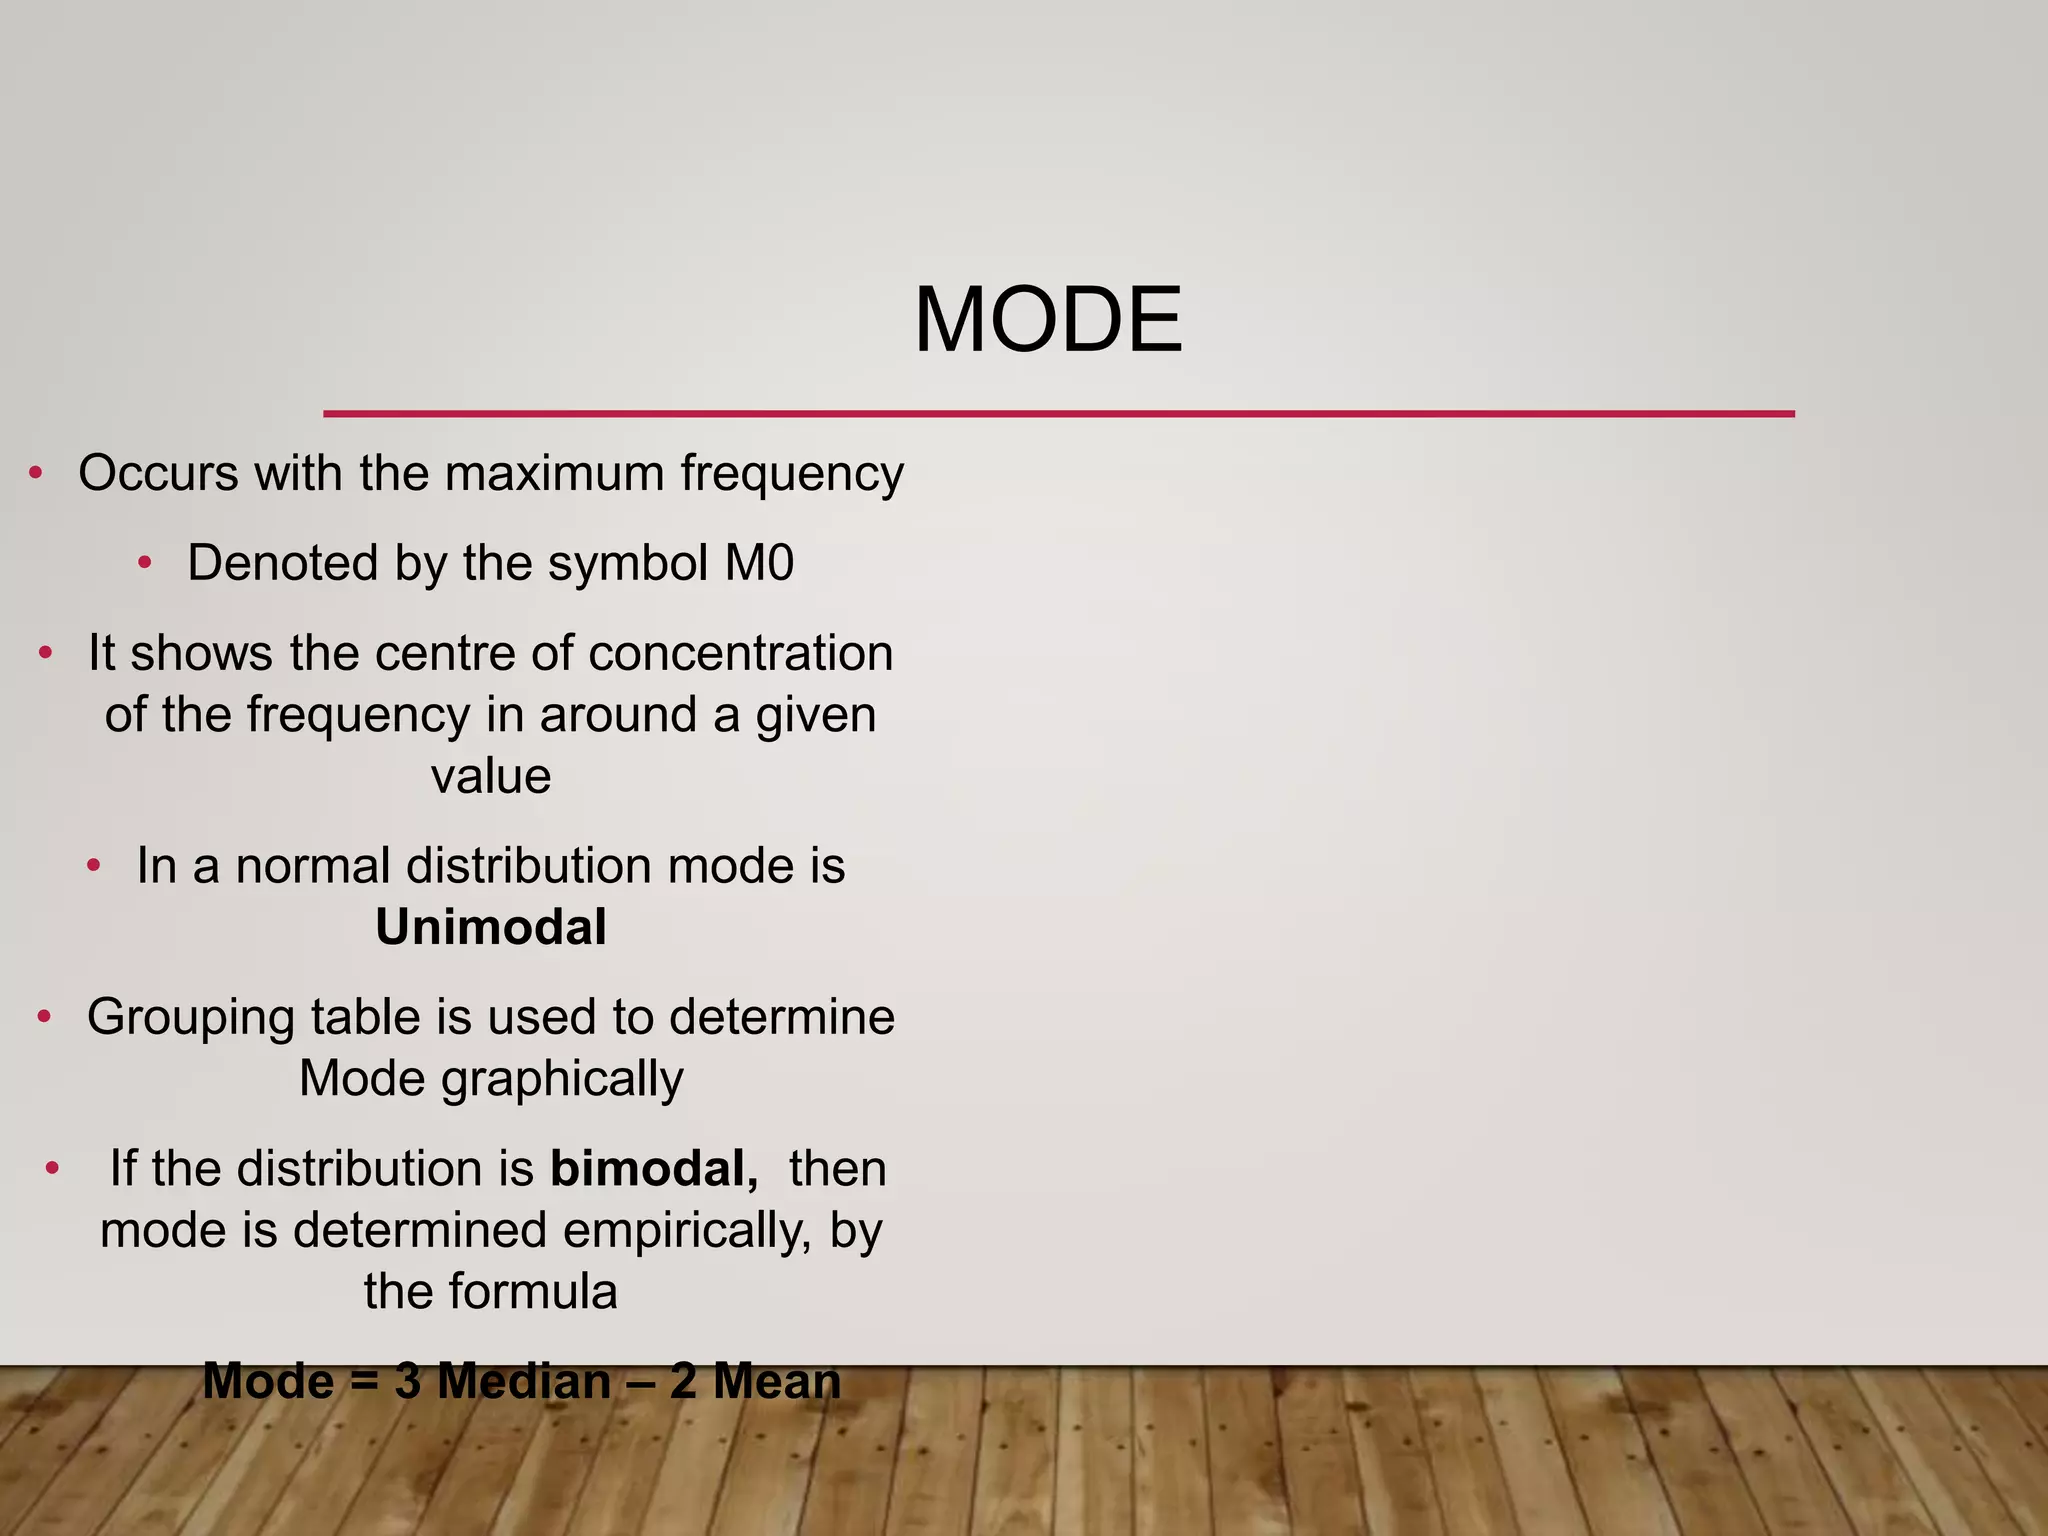
In a computational context, the mode is determined by the frequency of occurrences. If a software system tracks the “Operating System” used by visitors to a website, the data might look like this: [iOS, Android, Android, Windows, iOS, Android]. Here, “Android” appears three times, making it the mode. The symbol “Mo” would be used in technical documentation and statistical reports to denote this value.
In technology, we often encounter datasets that are unimodal (one mode), bimodal (two modes), or multimodal (multiple modes). Identifying these patterns allows developers to understand the distribution of data and identify “peaks” in system usage or user behavior.
Why “Mo” is Essential for Discrete Data Analysis
Technology thrives on discrete data. Whether it is error codes in a server log, the most clicked button on a mobile app, or the most frequent screen resolution of a user base, “Mo” provides an immediate snapshot of the most prevalent state.
For software engineers, knowing the mode is often more useful than knowing the average. For instance, if you are designing a game and the “average” player level is 15.5, that doesn’t tell you much about how to balance the game. However, if the “Mo” (Mode) is level 2, you immediately know that a massive portion of your user base is stuck or just starting, requiring a different technical approach to user retention.
Implementation of Mo in Modern Programming and Software
Modern software development relies heavily on libraries and built-in functions to calculate statistical measures. Understanding how “Mo” is handled programmatically is essential for any developer working with data-driven applications.
Calculating Mode in Python and R
Python, currently the leading language for AI and data science, provides several ways to calculate the mode. Using the statistics module, a developer can simply call statistics.mode(). For more complex datasets, the SciPy library offers scipy.stats.mode(), which returns both the modal value and the count of its occurrences.
In R, a language built specifically for statistics, the mode is handled differently because the built-in mode() function actually refers to the storage mode of an object. Data scientists must often write a custom function or use the stringr package to find the statistical “Mo.” This nuance highlights the importance of understanding the symbol’s context within specific programming environments.
Managing Multimodal Datasets in Software Engineering
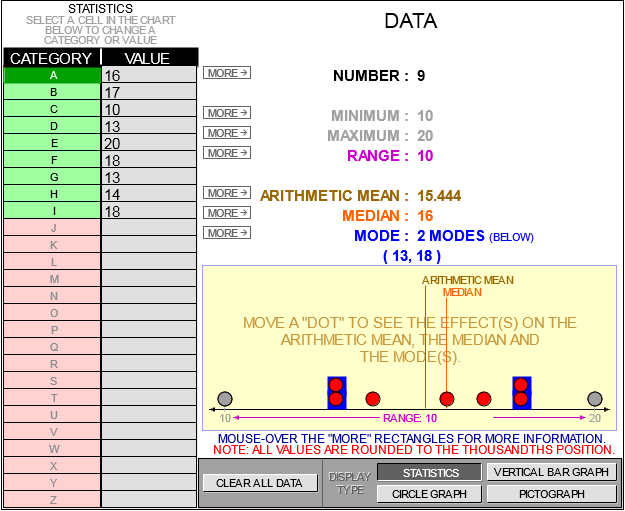
In production environments, data is rarely clean. A significant challenge in tech is handling datasets where multiple values share the highest frequency. When a system is bimodal, a simple “Mo” calculation might fail or return an incomplete picture.
Advanced software architectures use “tie-breaking” logic or return a list of modal values. In SQL, for instance, finding the mode requires a GROUP BY clause combined with a COUNT and ORDER BY to identify the top-ranking value. Ensuring that a software back-end can accurately identify the “Mo” symbol’s value even in skewed distributions is a hallmark of robust system design.
Mo and Artificial Intelligence: Beyond Simple Averages
Artificial Intelligence (AI) and Machine Learning (ML) represent the cutting edge of modern technology. Within these fields, the concept of the mode is leveraged for far more than simple counting; it is a vital part of model accuracy and data integrity.
The Importance of the Mode in Machine Learning Classification
Machine learning often involves classification tasks—predicting which category a new piece of data belongs to. Many “Ensemble Learning” techniques, such as Random Forests, rely on a “majority voting” system. In this context, the final output of the model is essentially the “Mo” of all the individual trees’ predictions.
By taking the mode of various algorithmic outputs, AI systems achieve higher reliability. If ten different sub-models analyze an image and seven say “Cat” while three say “Dog,” the system selects the mode—”Cat”—as the final result. This demonstrates how “Mo” serves as a logic gate for decision-making in autonomous systems.
Handling Missing Data via Mode Imputation
One of the most common problems in data science is “missing data.” When a dataset has gaps, it can break a machine learning model. A common technical solution is “Imputation,” where the missing values are filled in based on other data.
For categorical variables (like “User Language” or “Subscription Type”), you cannot use an average. You cannot “average” English and French. Instead, data engineers use Mode Imputation. By calculating the “Mo” of the existing data and filling the gaps with that value, they maintain the statistical integrity of the dataset without introducing the bias that might come from a random guess or a zero-value.
Data Visualization and the Mode Symbol
In the realm of UX/UI (User Experience/User Interface) and Product Management, the “Mo” symbol translates into visual insights. Technology professionals use the mode to simplify complex data for stakeholders and end-users.
Representing Mo in UX/UI Design Dashboards
Dashboards for SaaS (Software as a Service) platforms often need to highlight the “most popular” or “most frequent” activities. When a developer builds a dashboard for an e-commerce platform, they don’t just show a list of sales; they highlight the “Most Purchased Item.” Technically, this is the mode of the sales dataset.
Representing “Mo” visually—whether through a “Hot” tag, a highlighted bar in a histogram, or a “Trending” section—requires a real-time calculation of the mode. This involves back-end efficiency to ensure that as thousands of data points flow in, the “Mo” symbol is updated without causing latency in the user interface.
Identifying Trends through Peak Distributions
In data visualization, the mode represents the “peak” of a distribution curve. Tech analysts look for these peaks to identify software bugs or usage surges. If a server’s “Mo” for latency jumps from 20ms to 200ms, it signals a systemic issue that an average might hide. By focusing on the mode, tech teams can identify the most common experience of their users, rather than an idealized or skewed average.
The Future of Statistical Symbols in Big Data Environments
As we look toward the future of technology, the way we calculate and utilize the “Mo” symbol is evolving. With the rise of Edge Computing and Real-time Analytics, the “Mode” is becoming dynamic rather than static.
Real-time Data Streaming and Dynamic Modes
In the world of IoT (Internet of Things), devices generate constant streams of data. Calculating the mode of a static database is easy; calculating the “Mo” of a live stream of millions of data points per second requires specialized algorithms like “Count-Min Sketch.”
These probabilistic data structures allow tech systems to estimate the mode with high accuracy while using minimal memory. This is essential for cybersecurity (identifying the most frequent source of a DDoS attack) and social media (identifying the “Mo” of hashtags in real-time).
![]()
The Integration of Mo in Neural Network Architecture
Looking ahead, even the internal workings of neural networks are finding uses for modal logic. As we move toward more “interpretable AI,” understanding the most frequent pathways or activations within a network (the modal activation) can help researchers understand why an AI makes the decisions it does.
The symbol “Mo,” while rooted in ancient mathematics, remains a vital part of the developer’s toolkit. From the simple “statistics.mode()” function in a Python script to the complex majority-voting systems of a random forest regressor, the mode allows us to distill the “noise” of big data into the “signal” of the most frequent truth. For any tech professional, mastering the application of “Mo” is not just about math—it’s about building smarter, more responsive, and more efficient technology.
aViewFromTheCave is a participant in the Amazon Services LLC Associates Program, an affiliate advertising program designed to provide a means for sites to earn advertising fees by advertising and linking to Amazon.com. Amazon, the Amazon logo, AmazonSupply, and the AmazonSupply logo are trademarks of Amazon.com, Inc. or its affiliates. As an Amazon Associate we earn affiliate commissions from qualifying purchases.